Unlock a world of possibilities! Login now and discover the exclusive benefits awaiting you.
- Qlik Community
- :
- All Forums
- :
- QlikView App Dev
- :
- how to set value in gauge chart
- Subscribe to RSS Feed
- Mark Topic as New
- Mark Topic as Read
- Float this Topic for Current User
- Bookmark
- Subscribe
- Mute
- Printer Friendly Page
- Mark as New
- Bookmark
- Subscribe
- Mute
- Subscribe to RSS Feed
- Permalink
- Report Inappropriate Content
how to set value in gauge chart
Hi there,
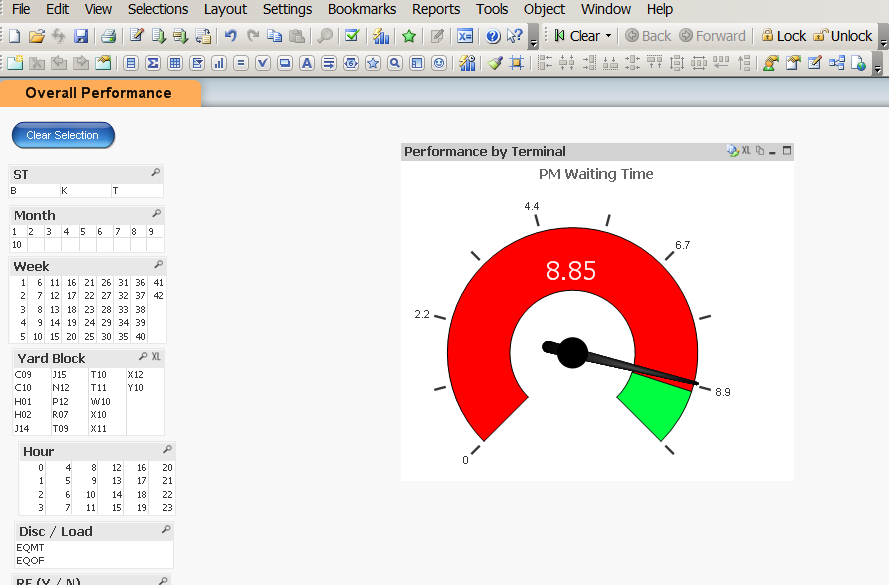
Trying to change from bar chart to gauage chart as YTD performance measurement.
But the value doesnt show up, please see attached sample.
Thanks
- Mark as New
- Bookmark
- Subscribe
- Mute
- Subscribe to RSS Feed
- Permalink
- Report Inappropriate Content
Like this?

- Mark as New
- Bookmark
- Subscribe
- Mute
- Subscribe to RSS Feed
- Permalink
- Report Inappropriate Content
Same as Hartmann, improved UI
- Mark as New
- Bookmark
- Subscribe
- Mute
- Subscribe to RSS Feed
- Permalink
- Report Inappropriate Content
Hi Frank,
Yes, i modified that when > 9.0 is in red zone, less than that in green zone.
Question:
How can set a reference line, example on 8.8
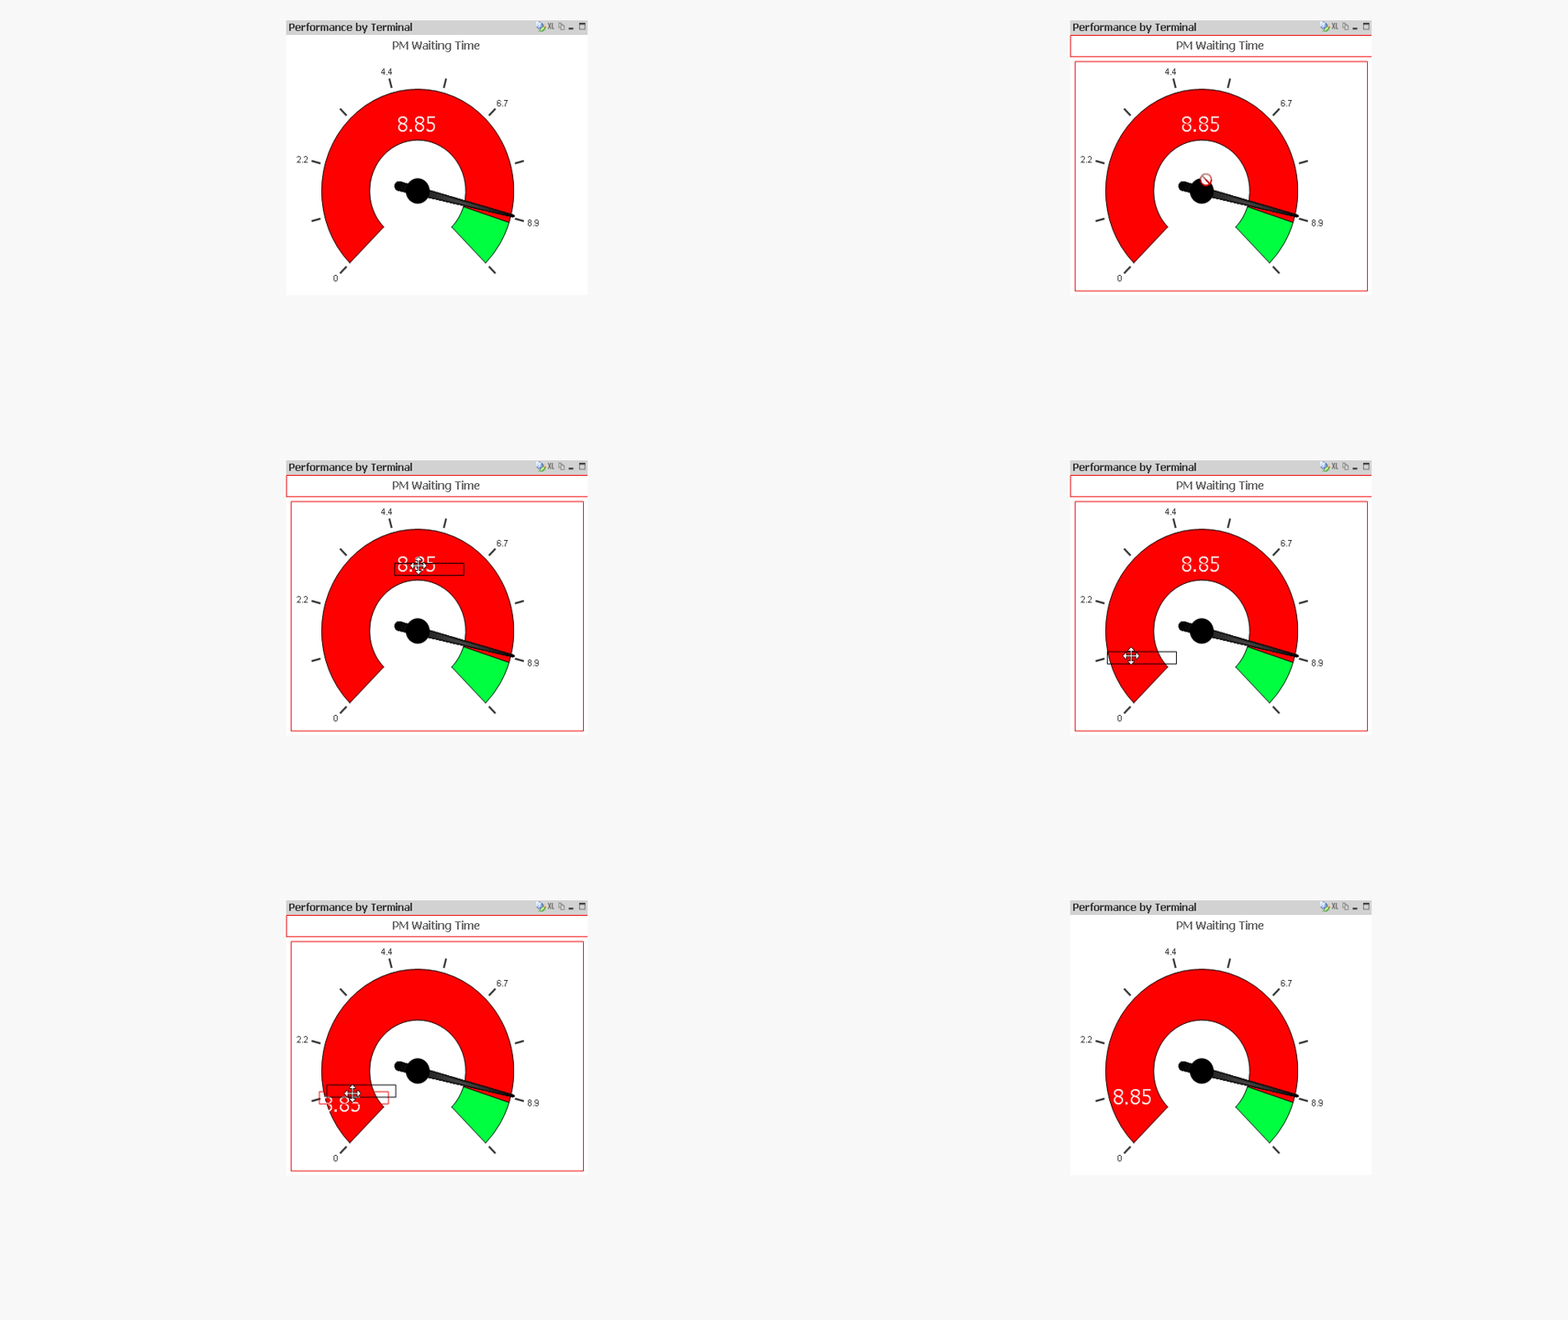
How can i move the text "8.85" to other position?
And how can set the field "ct" where value to "b" , "t" or "k" in each gauage chart? !
- Mark as New
- Bookmark
- Subscribe
- Mute
- Subscribe to RSS Feed
- Permalink
- Report Inappropriate Content
see attached qvw.
to move the value to another position just press ctrl+shift. the red borders of the text will appear and then you are able to move it to another position:

hope this helps
- Mark as New
- Bookmark
- Subscribe
- Mute
- Subscribe to RSS Feed
- Permalink
- Report Inappropriate Content
Hi Frank
Thanks, please see my edited file.
After arranged, I was trying to set the "By Yard Block' chart to show only the 'location' in the respective 'ct'
How can i change it?
Thanks
!
- Mark as New
- Bookmark
- Subscribe
- Mute
- Subscribe to RSS Feed
- Permalink
- Report Inappropriate Content
For the first "By Yard Block" chart try as follow:
count ({<location= {"=(sum({$<ct={'b'}>}PM_WAIT_TIME_Q)/ Count ({$<ct={'b'}>}CNTR_N))"}>}CNTR_N)
and do this analogue with the other "By Yard Block" charts.
hope this helps
- Mark as New
- Bookmark
- Subscribe
- Mute
- Subscribe to RSS Feed
- Permalink
- Report Inappropriate Content
Hello,
this is ok if you don't have any dimension but not if you have a calculated dimension.. .. .I didn't find any solution in this case 😞