Unlock a world of possibilities! Login now and discover the exclusive benefits awaiting you.
- Qlik Community
- :
- All Forums
- :
- QlikView App Dev
- :
- Re: latest date vs last date sales price growth
- Subscribe to RSS Feed
- Mark Topic as New
- Mark Topic as Read
- Float this Topic for Current User
- Bookmark
- Subscribe
- Mute
- Printer Friendly Page
- Mark as New
- Bookmark
- Subscribe
- Mute
- Subscribe to RSS Feed
- Permalink
- Report Inappropriate Content
latest date vs last date sales price growth
Hi friends,
Need a help urgently pls.
I have a data like this.
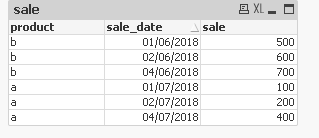
I have chart that shows date wise sales trend for each material based on material selection in listbox.
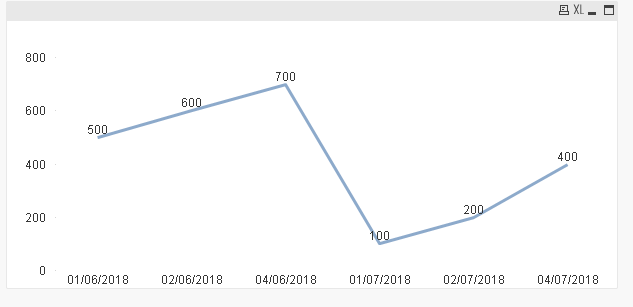
Now my requirement is to show for each product the % growth of sales from its latest date vs last date sales. and it will be shown on a text box on top of the gap between those dates.
So for ex: for product b sales growth % should be (700-600)/600*100 which is around 17 %
for product a this would be (400-200)/200*100 which is 100 %.
How can i do this?? pls help
- Mark as New
- Bookmark
- Subscribe
- Mute
- Subscribe to RSS Feed
- Permalink
- Report Inappropriate Content
Select a product to see it's growth in text box. Text box expression like:
=
( Sum({<sale_date={'$(=Date(Max(sale_date)))'}>}sale) -
1/Sum({<sale_date={'$(=Date(Max(sale_date, 2)))'}>}sale)
)
*100