Unlock a world of possibilities! Login now and discover the exclusive benefits awaiting you.
- Qlik Community
- :
- All Forums
- :
- QlikView App Dev
- :
- looping over expressions obtained in another table...
- Subscribe to RSS Feed
- Mark Topic as New
- Mark Topic as Read
- Float this Topic for Current User
- Bookmark
- Subscribe
- Mute
- Printer Friendly Page
- Mark as New
- Bookmark
- Subscribe
- Mute
- Subscribe to RSS Feed
- Permalink
- Report Inappropriate Content
looping over expressions obtained in another table for a graph
hello all,
am facing a real dillema with the generation of a report where i have to represent a product (obtained from another table through calculations) in a graph through its rank. I want to loop over the rank of the products i obtained from a table.
I obtained the ranks of the products by highest Inventory Coverage from a straight table as shown below
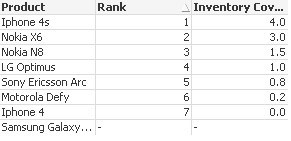
Now I need to build a graph for the first 3 products (Rank 1,2,3) displaying the Sales and Inventory coverage.
A graph like this for each product over the last X months. graph shows rank 1: Iphone 4s
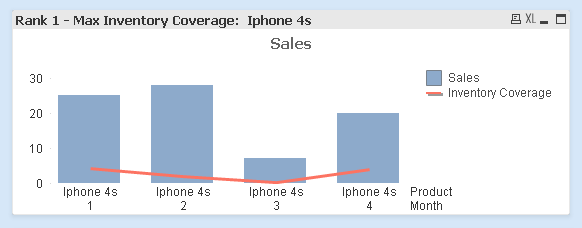
I need to generate same graph for the products ranked 2 and 3 also in my report also.
Please can someone help in how to make this possible.
The application is attached for your convenience and i ll be grateful if anyone could show me the way to make it possible.
Thanks in advance,
Rajiv