Unlock a world of possibilities! Login now and discover the exclusive benefits awaiting you.
- Qlik Community
- :
- All Forums
- :
- QlikView App Dev
- :
- need some urgent suggestions
- Subscribe to RSS Feed
- Mark Topic as New
- Mark Topic as Read
- Float this Topic for Current User
- Bookmark
- Subscribe
- Mute
- Printer Friendly Page
- Mark as New
- Bookmark
- Subscribe
- Mute
- Subscribe to RSS Feed
- Permalink
- Report Inappropriate Content
need some urgent suggestions
HI
I am creating a grid chart in the following way
- Tags:
- new_to_qlikview
- Mark as New
- Bookmark
- Subscribe
- Mute
- Subscribe to RSS Feed
- Permalink
- Report Inappropriate Content
you can attain this by using Trellis in the Dimension Tab of your pie chart
- Mark as New
- Bookmark
- Subscribe
- Mute
- Subscribe to RSS Feed
- Permalink
- Report Inappropriate Content
Hi WOW,
Maybe you can try to represent the same using gauge chart(speedometer style)
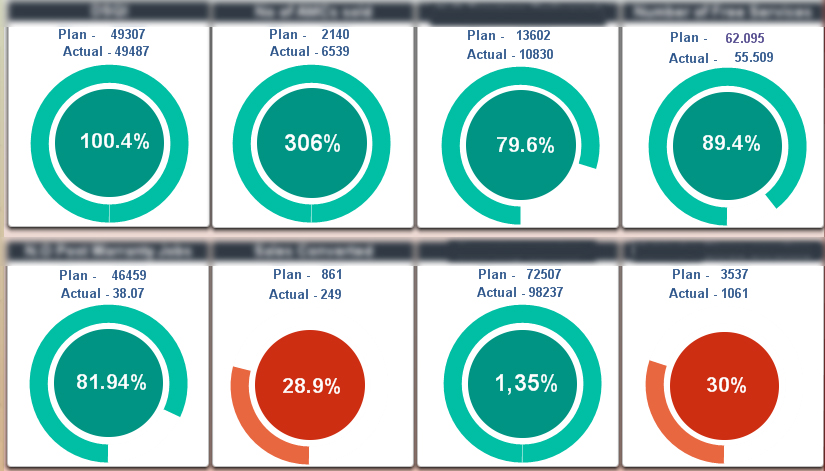
I have used the gauge chart along with a rounded corner text box ( textbox converted to circle by playing with the corner radius and squareness option in the layout tab. Where in Corner radius block select fixed and set it to 95 pts and squareness to 2). So use a Gauge chart. Go in the style tab and select the 1st style. Go in presentation tab and un-check show scale textbox. Set Angle Span to 360 degree. Set cylinder thickness to 20. In indicator block set mode to 'no indicator'(which will remove the needle) . In caption tab uncheck 'Show caption'. In layout tab uncheck 'Use borders'. Goin colors tab and set transparency to 100%. Apply your expressions and set the lower and upper bound for the gauge as required. To make the chart look better resize the circular textbox and bring it to the center of the gauge chart. pls refer the attached image for more clarity. 
- Mark as New
- Bookmark
- Subscribe
- Mute
- Subscribe to RSS Feed
- Permalink
- Report Inappropriate Content
Hi Rohan
Thanks for responding me
but I need to show only in grid chart and in the pie chart symbols of grid percentage should be visible
how can we approach
- Mark as New
- Bookmark
- Subscribe
- Mute
- Subscribe to RSS Feed
- Permalink
- Report Inappropriate Content
try with a trellis, like that

- Mark as New
- Bookmark
- Subscribe
- Mute
- Subscribe to RSS Feed
- Permalink
- Report Inappropriate Content
Hi
I am using grid chart inside that pie chart as a symbol options and in that I need to show percentages
so, how to reperesnt?
can u brief a bit more plz
- Mark as New
- Bookmark
- Subscribe
- Mute
- Subscribe to RSS Feed
- Permalink
- Report Inappropriate Content
in grid chart it seems to me you can't have value on data point
- Mark as New
- Bookmark
- Subscribe
- Mute
- Subscribe to RSS Feed
- Permalink
- Report Inappropriate Content
Yes,
but can u give me any approach how to show the percentage in grid chart