Unlock a world of possibilities! Login now and discover the exclusive benefits awaiting you.
- Qlik Community
- :
- All Forums
- :
- QlikView App Dev
- :
- Re: need to move a row into a column
- Subscribe to RSS Feed
- Mark Topic as New
- Mark Topic as Read
- Float this Topic for Current User
- Bookmark
- Subscribe
- Mute
- Printer Friendly Page
- Mark as New
- Bookmark
- Subscribe
- Mute
- Subscribe to RSS Feed
- Permalink
- Report Inappropriate Content
need to move a row into a column
Hi,
I have been searching but not able to find anything on this.
I need to shift one of my rows up into the column
Example
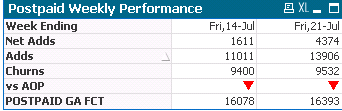
How my chart looks now.
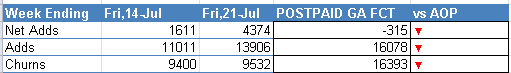
How I need it to look
At a complete loss,
Thanks for any help.
- Mark as New
- Bookmark
- Subscribe
- Mute
- Subscribe to RSS Feed
- Permalink
- Report Inappropriate Content
Two ways,
Reconstruct your data and use crosstable statement. Read about working with cross table. Another way is to create your table chart as a pivot table chart where you can dynamically change your columns and rows. If your provide a sample dataset I should be able to provide you with both options.
- Mark as New
- Bookmark
- Subscribe
- Mute
- Subscribe to RSS Feed
- Permalink
- Report Inappropriate Content
Hi Sean,
To me your table tables are saying different things. For example the first table says that the value of POSTPAID GA FCT was 16078 in week ending 14 July and was 16393 the following week.
The second table loses the relationship between that measure and the week. It's hard to make sense of the second table. The figure 16078 is given for the measure Adds in the week beginning POSTPAID GA FCT  .
.
Cheers
Andrew
- Mark as New
- Bookmark
- Subscribe
- Mute
- Subscribe to RSS Feed
- Permalink
- Report Inappropriate Content
Thanks for the replies.
@Andrew walker - Sorry didn't explain myself very well. For the second table I only wanted to show the Postpaid GA AOP for the second Week and the compare Prev Week vs Postpaid Ga (comparing last week to forecast for last week).
@Imad Zidan - Thanks for the idea, gave me a new way to try. I didn't end up with a cross table/pivot but lead me down the right path to correct my data model.
So in the final table I wanted to Show Actuals Numbers for 2 week ago, Actual Numbers for 1 Week ago and Forecast Numbers for 1 week ago. Then compare actual vs forecast from 1 week ago. I ended up with a solution that gave me the below. Which is the format I was after.
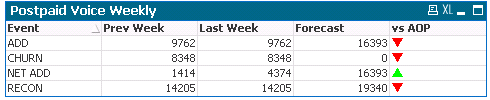
To get to this I ended up having to redo my data model. Initial I had my Actuals in my fact table and my forecast in a Dimension table. To get the above to work I ended up concatenating my Fact with actuals with my Forecast table, I added a new field which was a concatenation of Event suffix for Forecast
E.g
FIELD - EVENT
VALUES - Add, CHURN, RECON
FIELD - EVENT_2
VALUES - Add, Add-FCT, Churn, Churn-FCT, Recon, Recon-FCT
I was then able to create set analysis for make my column only count either "Add" for actuals (Prev Week, Last Week) or "Add-FCT" (Forecast, vs AOP) for Forecast. Whilst still been able to dimension by Event = Add.
- Mark as New
- Bookmark
- Subscribe
- Mute
- Subscribe to RSS Feed
- Permalink
- Report Inappropriate Content
Hi,
You need the Straight table for this and do calculation on the based of your metrics individually for particular expression.
Hope this helps
Regards,
Anand
- Mark as New
- Bookmark
- Subscribe
- Mute
- Subscribe to RSS Feed
- Permalink
- Report Inappropriate Content
Hi Sean,
You may try to use set expression in it
Thanks,
Arvind Patil