Unlock a world of possibilities! Login now and discover the exclusive benefits awaiting you.
- Qlik Community
- :
- All Forums
- :
- QlikView App Dev
- :
- not showing Null values in PIE CHART
- Subscribe to RSS Feed
- Mark Topic as New
- Mark Topic as Read
- Float this Topic for Current User
- Bookmark
- Subscribe
- Mute
- Printer Friendly Page
- Mark as New
- Bookmark
- Subscribe
- Mute
- Subscribe to RSS Feed
- Permalink
- Report Inappropriate Content
not showing Null values in PIE CHART
Hi Community
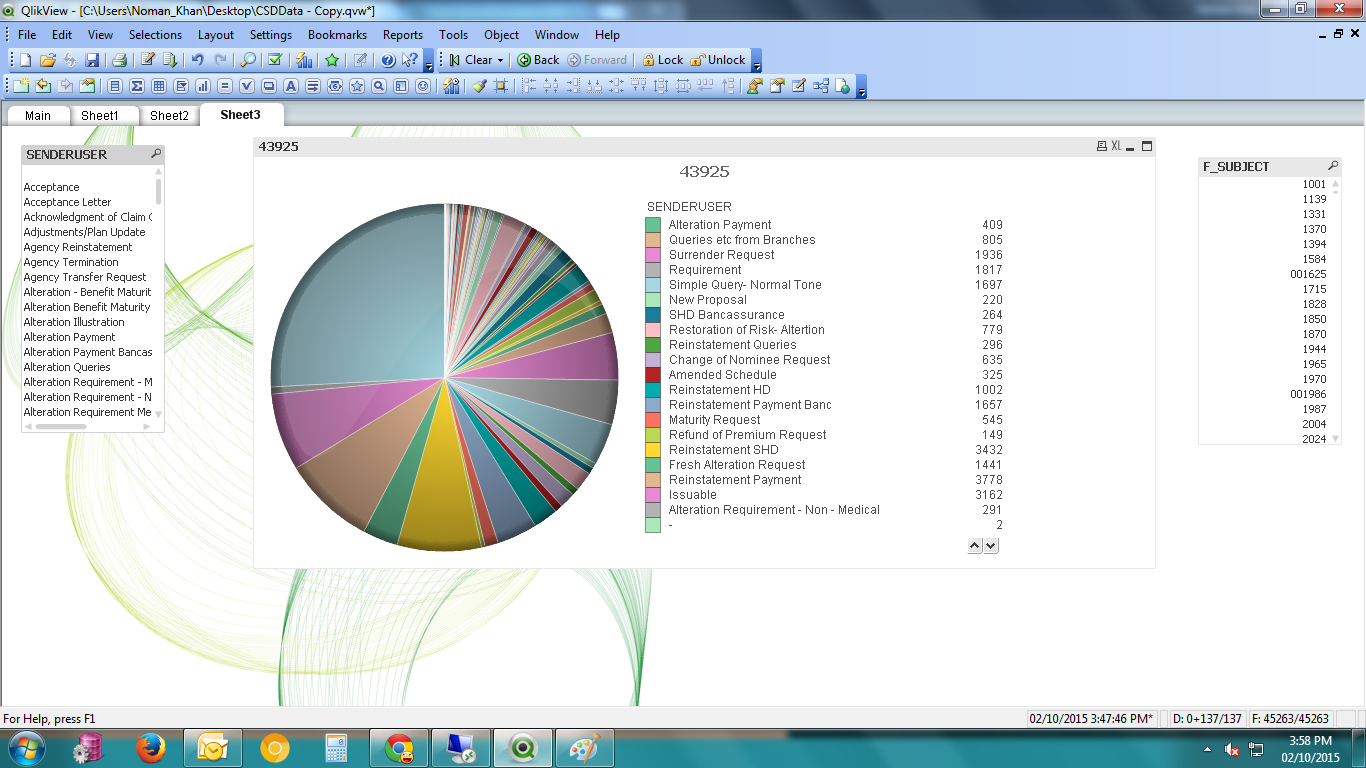
In my QVD fields SENDUSERS shows some null IDS from there i click its shows count for that Policy(F_SUBJECT).
But when i made a pie chart Using this Expression
=Count({$<CREATOR={'ameer_abbas'},F_USERNAME={'ameer_abbas'}>} F_SUBJECT)
and Taking SENDUSERS as a Dimension null values disappear,
Please refers the attached snap shot for clarification.
How can i resolve this issue.


Regards
Noman khan
- Tags:
- new_to_qlikview
Accepted Solutions
- Mark as New
- Bookmark
- Subscribe
- Mute
- Subscribe to RSS Feed
- Permalink
- Report Inappropriate Content
Set analysis is simply an automated selection, and operates the same way as users selections. Null is not a selectable value, so a simple set expression will also eliminate nulls.
If you want to make nulls selectable, you either need to replace nulls with some value during the load (like for example, 'inmapped', 'missing', 'other', '' (empty string) or zero). Or use NULLASVALUE on that field, which is effectively automatically replacing nulls with an empty string. Any of the above items are selectable.
- Mark as New
- Bookmark
- Subscribe
- Mute
- Subscribe to RSS Feed
- Permalink
- Report Inappropriate Content

- Mark as New
- Bookmark
- Subscribe
- Mute
- Subscribe to RSS Feed
- Permalink
- Report Inappropriate Content
Your first expression is including nulls in the pie chart because you are not basing it on any specific creator or user. In your second expression, you are specifically stating which creator or user you want in your dimension. You can have nulls display as an expression result, but nulls are not selectable.
Alos, as good practice, I would suggest another type of chart for what you are trying to show - typically pie charts loose their meaning if there are more than 5-6 slices. A bar chart sorted in descending order would work really will with the inforamtion you are trying to show