Unlock a world of possibilities! Login now and discover the exclusive benefits awaiting you.
- Qlik Community
- :
- All Forums
- :
- QlikView App Dev
- :
- Re: personalised dimension
- Subscribe to RSS Feed
- Mark Topic as New
- Mark Topic as Read
- Float this Topic for Current User
- Bookmark
- Subscribe
- Mute
- Printer Friendly Page
- Mark as New
- Bookmark
- Subscribe
- Mute
- Subscribe to RSS Feed
- Permalink
- Report Inappropriate Content
personalised dimension
Hello all,
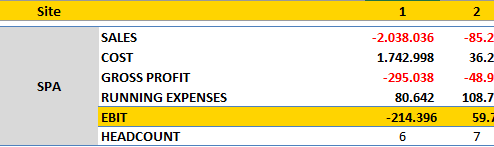
i need help with a pivot table:
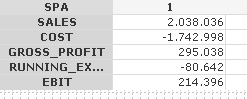
I need to separate in dimension:
SALES: DIMENSION;
COST: DIMENSION;
GROSS PROFIT: SALES + COST
RUNNING EXPENSES: DIMENSION
EBIT: GROSS PROFIT + RUNNING EXPENSES
HEADCOUNT: DIMENSION
How could I do this in a pivot table?
excel:
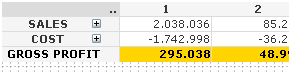
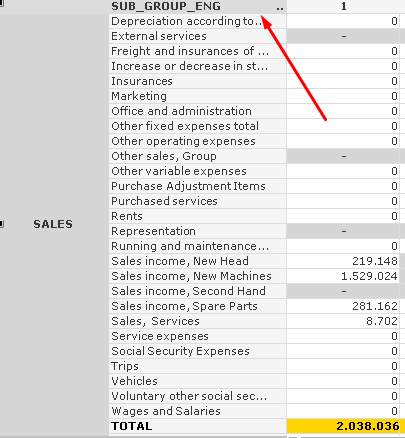
 qlik:
qlik:
tks
- Tags:
- qlikview develop
- Mark as New
- Bookmark
- Subscribe
- Mute
- Subscribe to RSS Feed
- Permalink
- Report Inappropriate Content
You can use valuelist for cases where custom dimensions are required. See below
ValueList() – For those tricky situations
But in your case why do you need custom dimensions? You can use a standard pivot table
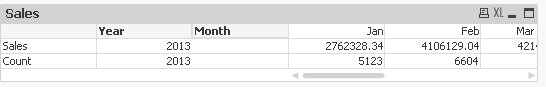
you can put all 6 as expressions. your site (the 1,2s) as the dimension
e.g. like below
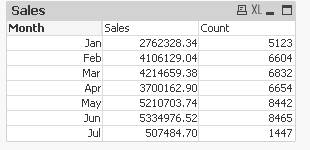
and drag the expressions into rows and dimension as a column to create below
But if i missed something. value list would be the way to go
- Mark as New
- Bookmark
- Subscribe
- Mute
- Subscribe to RSS Feed
- Permalink
- Report Inappropriate Content
tks for info Dilip.
I was thinking about that but the problem is that if I add a sub group dimension, it's not possible to pivot.
do you have a solution for this?
this is ok:
i need to pivot: collapse sub_group_eng
- Mark as New
- Bookmark
- Subscribe
- Mute
- Subscribe to RSS Feed
- Permalink
- Report Inappropriate Content
Not sure exaclty what you want to achieve.If you share a sample excel table or something i can help further
but you can pivot. see below a few things
- Mark as New
- Bookmark
- Subscribe
- Mute
- Subscribe to RSS Feed
- Permalink
- Report Inappropriate Content
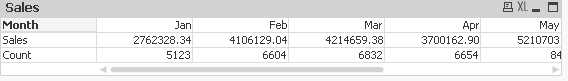
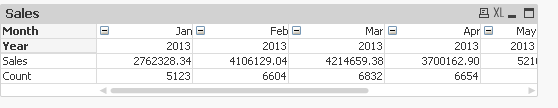
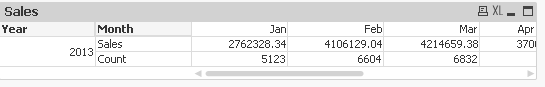
it works if i put in horizontal the sub group:
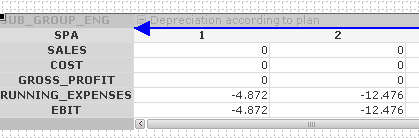
but I need in vertical with + sign to expande and collapse.

- Mark as New
- Bookmark
- Subscribe
- Mute
- Subscribe to RSS Feed
- Permalink
- Report Inappropriate Content
Ah ok. then you might need the value list option which i shared before.
basically you create custom dimensions on the fly and within a single expression for each 'dimension' like Sales you give the formula for each one.
let me know if you have troubles
- Mark as New
- Bookmark
- Subscribe
- Mute
- Subscribe to RSS Feed
- Permalink
- Report Inappropriate Content
Hi Samuel,
Below holds if your facts are additive, so Gross Profit =Sales minus Cost of Sales per my accountancy text book, but what you have is fine as long as the signs are appropriate on the facts.
So an accounting system would hold a mapping of low level account codes through a hierarchy to EBIT, similar to;
| Level 1 | Level 2 | Level 3 | Level 4 |
|---|---|---|---|
EBIT | GROSS PROFIT | SALES | eg Sales Income |
| EBIT | GROSS PROFIT | COST | eg Rent |
| EBIT | RUNNING EXPENSES | RUNNING EXPENSES | eg Marketing |
| HEADCOUNT | HEADCOUNT | HEADCOUNT | HEADCOUNT |
So I would construct a table like the above with Level 4 linking through to your facts & use the Level 1-3 I the pivot table with summary totals where appropriate.
Cheers,
Chris.
- Mark as New
- Bookmark
- Subscribe
- Mute
- Subscribe to RSS Feed
- Permalink
- Report Inappropriate Content
tks for info.
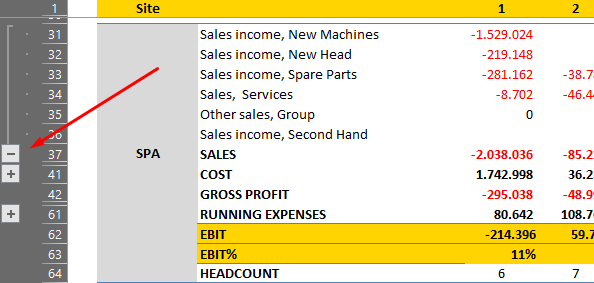
the user wanna like bellow:
is that possible?
- Mark as New
- Bookmark
- Subscribe
- Mute
- Subscribe to RSS Feed
- Permalink
- Report Inappropriate Content
Hi Samuel,
If your user has very fixed ideas that this should look exactly like Excel then you may have a struggle on your hands  , maybe they need Power Pivot
  .
.
Let me see if I can get close, but I will give up if it is fighting too hard.
Cheers,
Chris.
- Mark as New
- Bookmark
- Subscribe
- Mute
- Subscribe to RSS Feed
- Permalink
- Report Inappropriate Content
kkk.yes Chris...i agree..tks 4 help.