Unlock a world of possibilities! Login now and discover the exclusive benefits awaiting you.
- Qlik Community
- :
- All Forums
- :
- QlikView App Dev
- :
- Re: pie chart slice not showing values
- Subscribe to RSS Feed
- Mark Topic as New
- Mark Topic as Read
- Float this Topic for Current User
- Bookmark
- Subscribe
- Mute
- Printer Friendly Page
- Mark as New
- Bookmark
- Subscribe
- Mute
- Subscribe to RSS Feed
- Permalink
- Report Inappropriate Content
pie chart slice not showing values
Hi,
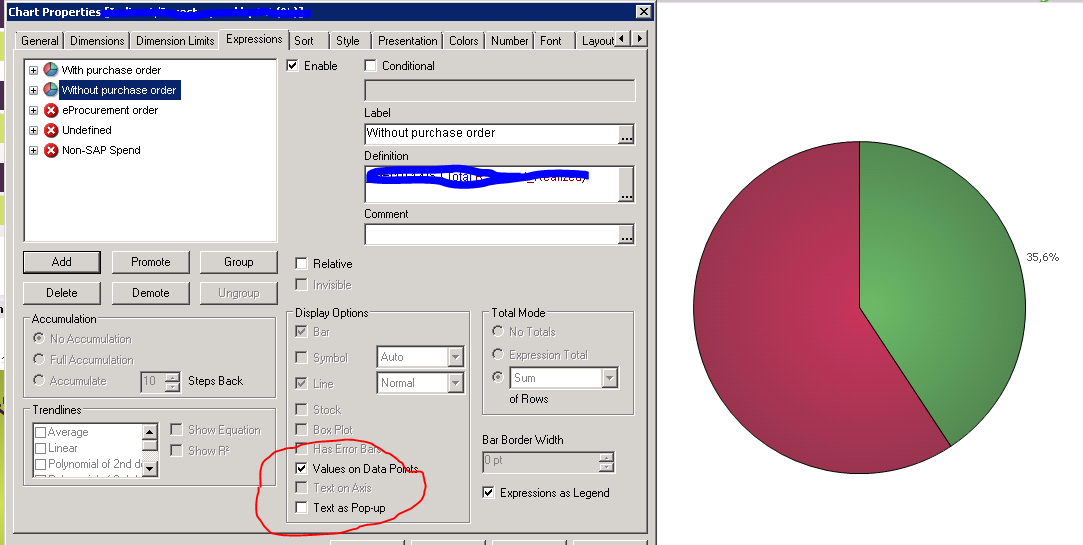
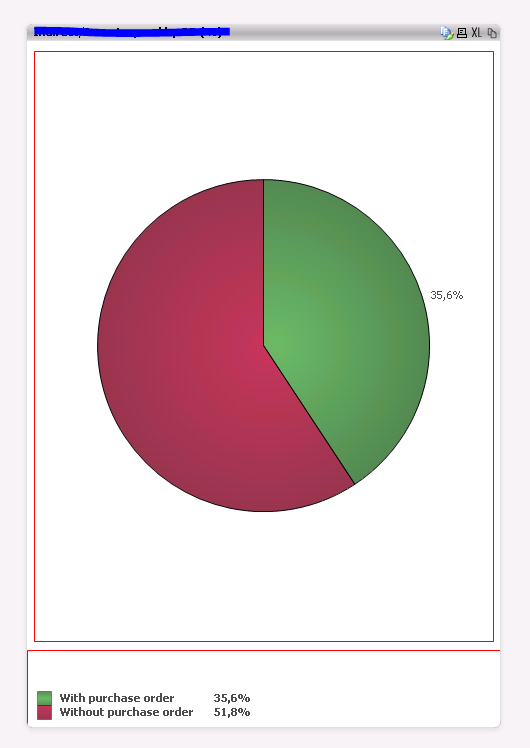
Despite checking the option "Values on Data Points", The pie chart is not showing values for few slices in a pie chart. Only one slice is showing values. I have disabled the rest of slices expressions and only enabled two. One is showing the values but the other one is not
Have a look at the attached image for example

Can someone please tell me what could be the reason of pie chart not showing the value on data points. I have also selected ctrl+shift to see if the area of the pie chart is going out of area and the value might be hiding out of the region but the pie chart is well inside its region and I cannot see anything going out

Can someone please suggest how could I fix this
Regards
Arif
- Tags:
- piechart
- « Previous Replies
-
- 1
- 2
- Next Replies »
- Mark as New
- Bookmark
- Subscribe
- Mute
- Subscribe to RSS Feed
- Permalink
- Report Inappropriate Content
Value on Data points will definitely help in displaying the value outside the Pie chart. If you want the value for legend please enable presentation -> Show numbers in legend
- Mark as New
- Bookmark
- Subscribe
- Mute
- Subscribe to RSS Feed
- Permalink
- Report Inappropriate Content
My question is that even though the values on data point is selected, its not showing on pie chart. One slice is showing, other is not. What could be wrong with it so that I can fix it. Its showing in legend and even shows in tooltip but is not showing as value on data point on pie chart
How do I fix this?
Shah
- Mark as New
- Bookmark
- Subscribe
- Mute
- Subscribe to RSS Feed
- Permalink
- Report Inappropriate Content
Hi
I suggest that you delete the disabled expressions. Sometimes they interfere with the chart rendering.
HTH
Jonathan
- Mark as New
- Bookmark
- Subscribe
- Mute
- Subscribe to RSS Feed
- Permalink
- Report Inappropriate Content
Hi,
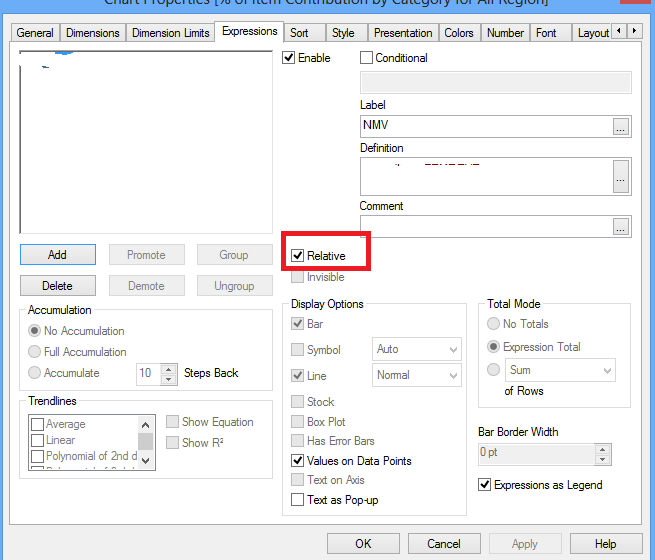
Check the Relative option.

- Mark as New
- Bookmark
- Subscribe
- Mute
- Subscribe to RSS Feed
- Permalink
- Report Inappropriate Content
I need them all. I had disabled it only for the purpose of checking whether two slices will show the values on pie chart. If I enable only on of them, then all of them show values. However on enabling more than one, only one slice will show values on data point
Shah
- Mark as New
- Bookmark
- Subscribe
- Mute
- Subscribe to RSS Feed
- Permalink
- Report Inappropriate Content
Nope, checking the relative changes everything completely. I think relative works only when you have grouping by dimensions and one expression only
- Mark as New
- Bookmark
- Subscribe
- Mute
- Subscribe to RSS Feed
- Permalink
- Report Inappropriate Content
May be you can try another alternative method to achieve this.
1. Create an inline table with two the values 'with purchase order' and 'without purchase order'.
2. Add this as a dimension to your pie chart
3. Write only one expression, in which use If statement to apply different expressions for different inline table values
Hope this helps?
- Mark as New
- Bookmark
- Subscribe
- Mute
- Subscribe to RSS Feed
- Permalink
- Report Inappropriate Content
Hi,
Try creating new pie chart without copying the same object (pie chart).
By doing this ,may be you get some idea why 2nd slice is not showing result.
Slice of pie chart is according to the expression result that comes after grouping the dimension value ,one expression has to show value of all the slices.
If you use three expressions ,then there will be three values per slice of pie chart.
hope it helps.
Thanks,
Geeta
- Mark as New
- Bookmark
- Subscribe
- Mute
- Subscribe to RSS Feed
- Permalink
- Report Inappropriate Content
I tried creating a new file and create a new pie chart. I entered two expressions with constant values 2 and 8 in their expressions. I checked "values on data points" to show the labels. The first slice showed value but the second one did not. If I change it into bar, then all the values show up
Could it be some kind of bug in the qlikview designer? I am not sure anymore
Shah
- « Previous Replies
-
- 1
- 2
- Next Replies »