Unlock a world of possibilities! Login now and discover the exclusive benefits awaiting you.
- Qlik Community
- :
- All Forums
- :
- QlikView App Dev
- :
- Re: pivot table: only mark totals under 750 in col...
- Subscribe to RSS Feed
- Mark Topic as New
- Mark Topic as Read
- Float this Topic for Current User
- Bookmark
- Subscribe
- Mute
- Printer Friendly Page
- Mark as New
- Bookmark
- Subscribe
- Mute
- Subscribe to RSS Feed
- Permalink
- Report Inappropriate Content
pivot table: only mark totals under 750 in colour, not the values for the dimension
Hello,
i have a pivot table in which i have an expression that is shown for the dimension status.
Now i added the total of the expression for the dimension, but i want to show the result in red if it is below 750.
This is the table:

I want only to show the total of 738,6 in red and not the 434 en 304,6 because this will probably be the most of the time below 700.
Is this possible?
i did it like this:
thanx!!
grtz,
Chris
Accepted Solutions
- Mark as New
- Bookmark
- Subscribe
- Mute
- Subscribe to RSS Feed
- Permalink
- Report Inappropriate Content
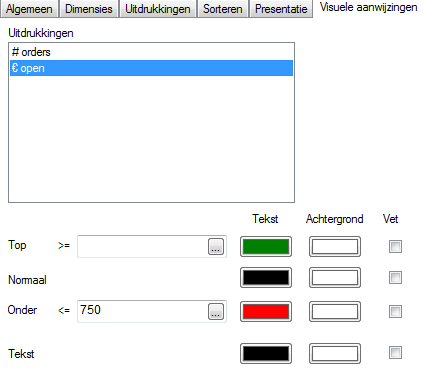
You're going to need to do this a different way. Click on the + in front of the expression on the Expressions tab and select Text color. Then enter an expression like this: if(SecondaryDimensionality()=0 and sum(MyValue)<750,lightred())
See attached example.
talk is cheap, supply exceeds demand
- Mark as New
- Bookmark
- Subscribe
- Mute
- Subscribe to RSS Feed
- Permalink
- Report Inappropriate Content
Chris
Would you be able to make the Total an expression ?
If so then click the + by the expression and for Text Colour put in if statement expression to set it red() or black() as per your thresholds.
Best Regards, Bill
- Mark as New
- Bookmark
- Subscribe
- Mute
- Subscribe to RSS Feed
- Permalink
- Report Inappropriate Content
Hey Gysbert,
thanx for you reply, this works perfectly!
to understand what happens, could you explain what the secondaryDimensionality stands for?
thanx!
Chris
- Mark as New
- Bookmark
- Subscribe
- Mute
- Subscribe to RSS Feed
- Permalink
- Report Inappropriate Content
It returns the 'subtotal level' of a horizontally displayed dimension. Just as dimensionality() does for dimensions shown as columns.
As the help file puts it:
returns the number of dimension pivot table rows that have non-aggregation content. i.e. do not contain partial sums or collapsed aggregates. This function is the equivalent of the dimensionality() function for horizontal pivot table dimensions.
The secondarydimensionality() function always returns 0 when used outside of pivot tables.
talk is cheap, supply exceeds demand
- Mark as New
- Bookmark
- Subscribe
- Mute
- Subscribe to RSS Feed
- Permalink
- Report Inappropriate Content
ok, thank you very much!!!