Unlock a world of possibilities! Login now and discover the exclusive benefits awaiting you.
- Qlik Community
- :
- All Forums
- :
- QlikView App Dev
- :
- Re: previous 13 weeks of data
- Subscribe to RSS Feed
- Mark Topic as New
- Mark Topic as Read
- Float this Topic for Current User
- Bookmark
- Subscribe
- Mute
- Printer Friendly Page
- Mark as New
- Bookmark
- Subscribe
- Mute
- Subscribe to RSS Feed
- Permalink
- Report Inappropriate Content
previous 13 weeks of data
Dear Community,
I'm trying to display a graph that has weeks as the dimension - the graph should only ever show 13 weeks of data regardless of the selections made (based on the maximum date value)
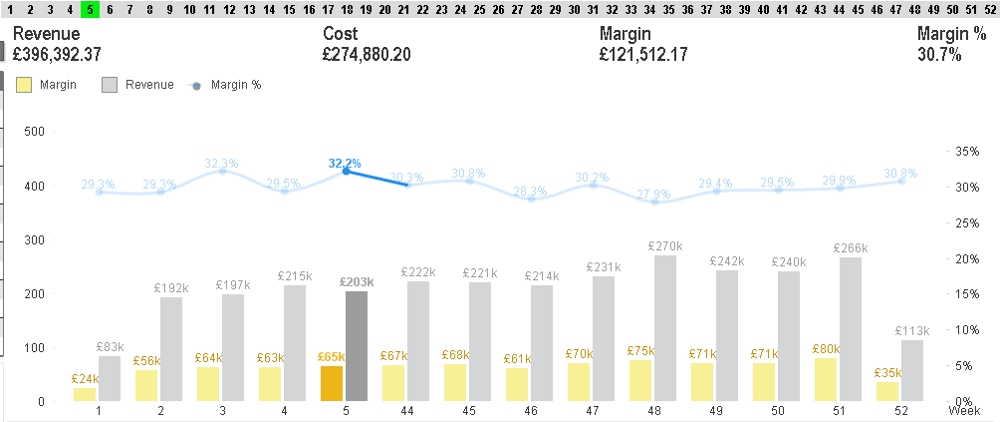
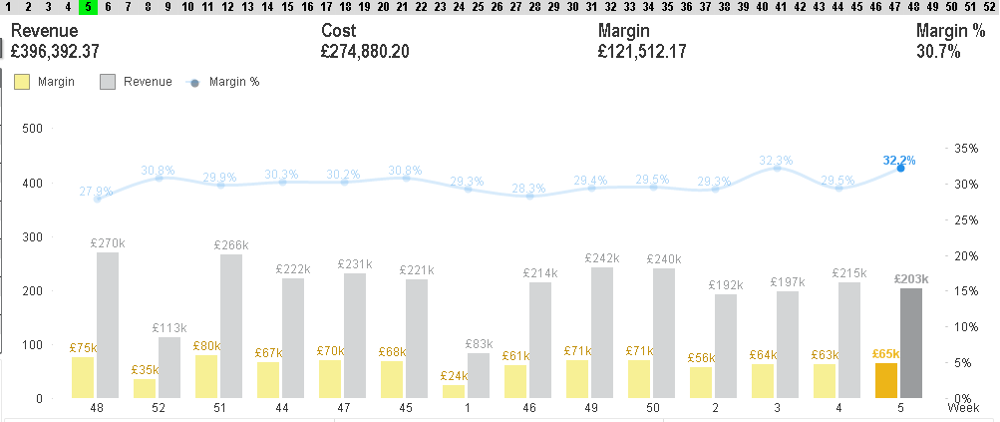
I've set up the appropriate variables and set analysis so that the correct date range is captured, however the order of my week dimension seems to be completely random. I'm not sure what sorting expression i can include to display the weeks correctly?
Sorting on the numeric value of the week works best but does not work when week 5 is selected (as the previous 13 weeks include week 52 from the previous year.
Below are some screen shots:
Sorting by numeric value

Sorting by Date

Please help!!
Accepted Solutions
- Mark as New
- Bookmark
- Subscribe
- Mute
- Subscribe to RSS Feed
- Permalink
- Report Inappropriate Content
Try again. Copied your set analysis from expression to sorting function. Should work
- Mark as New
- Bookmark
- Subscribe
- Mute
- Subscribe to RSS Feed
- Permalink
- Report Inappropriate Content
Please attach an example. There are several ways to achieve it, depending from your data
- Mark as New
- Bookmark
- Subscribe
- Mute
- Subscribe to RSS Feed
- Permalink
- Report Inappropriate Content
Sorry - attached is an example
- Mark as New
- Bookmark
- Subscribe
- Mute
- Subscribe to RSS Feed
- Permalink
- Report Inappropriate Content
Hi Drew
Little change on Sort tab.
Also i did a little change for Min date variable calculation. Your was correct, however the first week on your graph always will be not complete and useless to compare with the next one. Use it on your own judgment
- Mark as New
- Bookmark
- Subscribe
- Mute
- Subscribe to RSS Feed
- Permalink
- Report Inappropriate Content
Hi Yuriy,
Thank you very much for your help but I'm afraid you are encountering the same issue as me - if, on your example, you select 2015 as the year. The "2014" data which is shown due to the set analysis displays as 49, 52, 50, 51.....
This is the issue i am encountering!
Many thanks,
Drew
- Mark as New
- Bookmark
- Subscribe
- Mute
- Subscribe to RSS Feed
- Permalink
- Report Inappropriate Content
Try again. Copied your set analysis from expression to sorting function. Should work
- Mark as New
- Bookmark
- Subscribe
- Mute
- Subscribe to RSS Feed
- Permalink
- Report Inappropriate Content
PERFECT!!!!!!!!!!!!!