Unlock a world of possibilities! Login now and discover the exclusive benefits awaiting you.
- Qlik Community
- :
- All Forums
- :
- QlikView App Dev
- :
- quarter over quarter
- Subscribe to RSS Feed
- Mark Topic as New
- Mark Topic as Read
- Float this Topic for Current User
- Bookmark
- Subscribe
- Mute
- Printer Friendly Page
- Mark as New
- Bookmark
- Subscribe
- Mute
- Subscribe to RSS Feed
- Permalink
- Report Inappropriate Content
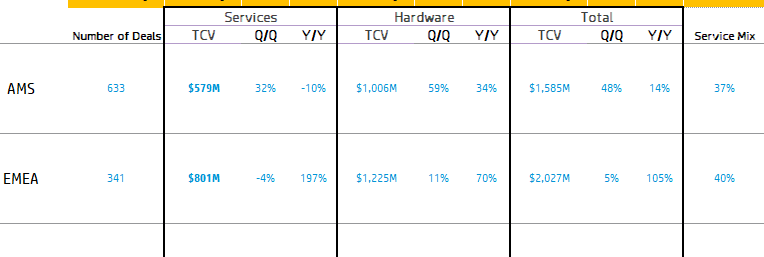
quarter over quarter
Hi all
i want to calculate the QoQ and YoY like below attached screen shot in pivot table.
and the data is attached it is coming from db directly.
how can i do this?
- « Previous Replies
-
- 1
- 2
- Next Replies »
- Mark as New
- Bookmark
- Subscribe
- Mute
- Subscribe to RSS Feed
- Permalink
- Report Inappropriate Content
sorry for mis lead 
i need the same table which was done by you.... its for 4quarters i.e current quarter and next 3 quarters
second table i need with
region ,type, Tcv Qoq Yoy -----------------this will consists by default 4qtrs and beyond 2019Q3
- Mark as New
- Bookmark
- Subscribe
- Mute
- Subscribe to RSS Feed
- Permalink
- Report Inappropriate Content
Hi Sony,
Modified the graph but didnt understand the second graph explanation.
Maybe you can try and get it from the info and graphs that are already in the app an create the visualization you need.
- Mark as New
- Bookmark
- Subscribe
- Mute
- Subscribe to RSS Feed
- Permalink
- Report Inappropriate Content
thanks for your inputs sir felipedl
- Mark as New
- Bookmark
- Subscribe
- Mute
- Subscribe to RSS Feed
- Permalink
- Report Inappropriate Content
Glad it helped :).
- « Previous Replies
-
- 1
- 2
- Next Replies »