Unlock a world of possibilities! Login now and discover the exclusive benefits awaiting you.
- Qlik Community
- :
- All Forums
- :
- QlikView App Dev
- :
- question on suppressing a field from a dimension l...
- Subscribe to RSS Feed
- Mark Topic as New
- Mark Topic as Read
- Float this Topic for Current User
- Bookmark
- Subscribe
- Mute
- Printer Friendly Page
- Mark as New
- Bookmark
- Subscribe
- Mute
- Subscribe to RSS Feed
- Permalink
- Report Inappropriate Content
question on suppressing a field from a dimension list
I'm trying to build a pivot table in the form of a tree structure.
I am aware of the 'Tree View' but need to explore some other options.
I'm using the Hierarchy function to build my hierarchy view as below in the code segment:
##################################################################
H1:
Hierarchy(NodeId, ParentId, NodeName, , ,NodePath,|, NodeDepth)
LOAD
Node as NodeId,
Parent as ParentId,
NodeName as NodeName,
NodeName as REP_SUB_BS_ITEM,
IS_LEAF,
PRIORITY
FROM
##################################################################
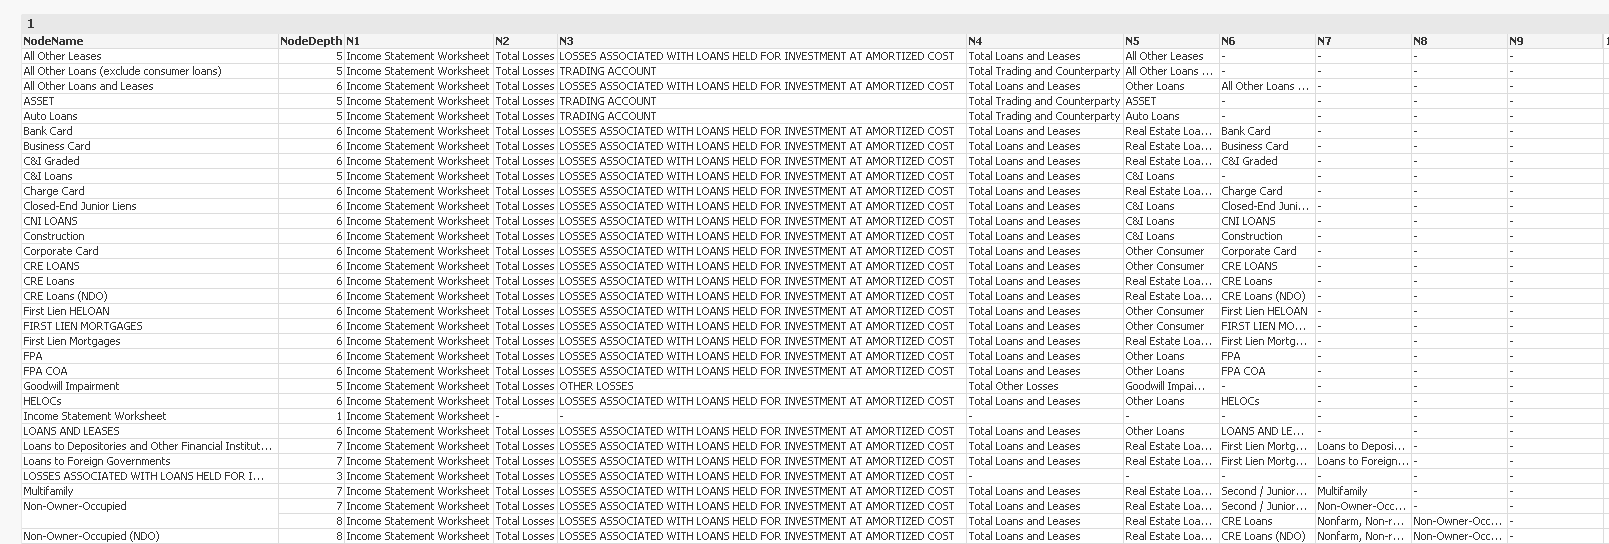
My question is this - assuming my maximum Nodedepth is at 8.
Based on the below code - how do I suppress the 9th column from displaying in my pivot chart.
I need to do this as I do not know how many levels I have in the unbalanced hierarchy.
Right now it is diplaying with "-" as in the the attached image.
=pick(match(NodeDepth,'1','2','3','4','5','6','7','8','9'),
null(),
null(),
null(),
null(),
null(),
null(),
null(),
null(),
NodeName9
)
- Tags:
- hierarchy
- Mark as New
- Bookmark
- Subscribe
- Mute
- Subscribe to RSS Feed
- Permalink
- Report Inappropriate Content
Why not just remove N9 from the dimension list of the Pivot Chart?