Unlock a world of possibilities! Login now and discover the exclusive benefits awaiting you.
- Qlik Community
- :
- All Forums
- :
- QlikView App Dev
- :
- scale (aggregated) axis to 100%
- Subscribe to RSS Feed
- Mark Topic as New
- Mark Topic as Read
- Float this Topic for Current User
- Bookmark
- Subscribe
- Mute
- Printer Friendly Page
- Mark as New
- Bookmark
- Subscribe
- Mute
- Subscribe to RSS Feed
- Permalink
- Report Inappropriate Content
scale (aggregated) axis to 100%
Hi there,
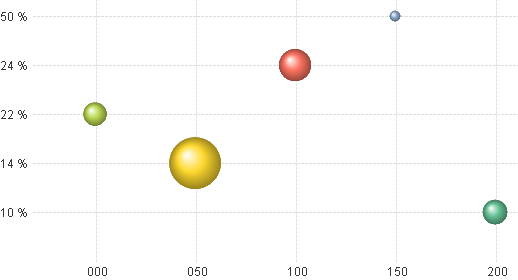
I have created a bubble chart (see other ticket regarding this issue: link😞

Now I'd like to achieve a couple of more things.
The first thing I'd like to get to is a 100% scale on the y-axis.
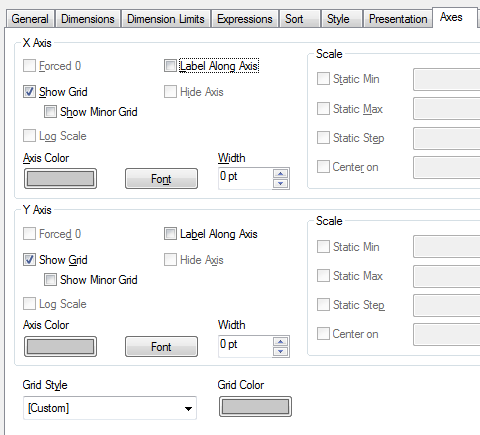
Unfortunately the "Static Max" checkbox is greyed out:

I guess that the reason behind this might be the calculated dimension for that axis:
=NUM( ( aggr( Sum({$<[accepted]={1}>} [accepted])
/ Sum({$<[accepted]={1}>} Cntr) , [range]
)
), '#, %')
Not sure about that, though.
It always autoscales the axis but I really would like to have it to always show 100%.
Any idea how to get there?
Another question would be to show another dimension (int values) on the x-axis at the 0-line. IS that possible? I think I have seen that somewhere but can't find the option for that.
Any help is appreciated!