Unlock a world of possibilities! Login now and discover the exclusive benefits awaiting you.
- Qlik Community
- :
- All Forums
- :
- QlikView App Dev
- :
- set analysis on line chart
- Subscribe to RSS Feed
- Mark Topic as New
- Mark Topic as Read
- Float this Topic for Current User
- Bookmark
- Subscribe
- Mute
- Printer Friendly Page
- Mark as New
- Bookmark
- Subscribe
- Mute
- Subscribe to RSS Feed
- Permalink
- Report Inappropriate Content
set analysis on line chart
in the line chart -if I want to click on open then list of records will dispaly on open condition and click on close then close records will diplay.
I want to do it using set anaylysis. Please help me construct the below expression.
IF( only(Status) = 'Open', sum( {<Status = 'Open'>} 1), sum({<Status='Close'>} 1))
- Tags:
- set_analys
- « Previous Replies
- Next Replies »
- Mark as New
- Bookmark
- Subscribe
- Mute
- Subscribe to RSS Feed
- Permalink
- Report Inappropriate Content

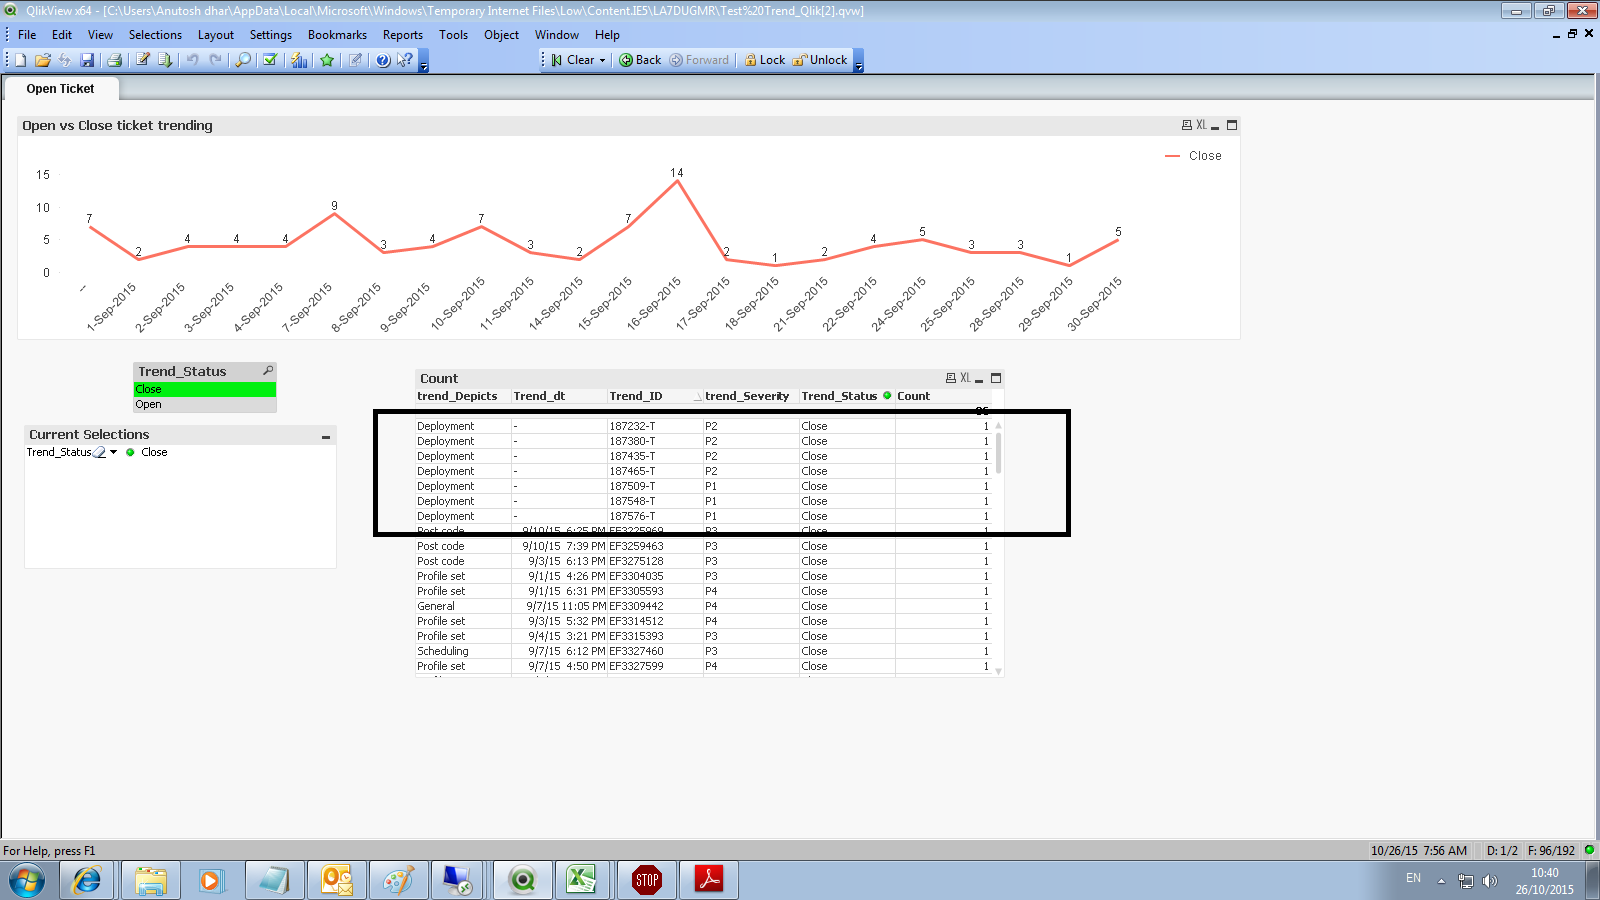
I have marked it in the image. All those ticket now in open state but if i click on close then it is also showing which should not.
- Mark as New
- Bookmark
- Subscribe
- Mute
- Subscribe to RSS Feed
- Permalink
- Report Inappropriate Content
attached the screenshot
- Mark as New
- Bookmark
- Subscribe
- Mute
- Subscribe to RSS Feed
- Permalink
- Report Inappropriate Content
Hi Pradeep,
Any luck?
Regards
- Mark as New
- Bookmark
- Subscribe
- Mute
- Subscribe to RSS Feed
- Permalink
- Report Inappropriate Content
for those records, your data showing the status as close, without any calculations...
Please specify your condition, when we consider weather the ticket is closed/open state?
are you considering Trend_Status field only or considering any other field as well?
- Mark as New
- Bookmark
- Subscribe
- Mute
- Subscribe to RSS Feed
- Permalink
- Report Inappropriate Content
onle trend stats we need to consider.
suppose we opend 2 tickets today and closed one amon 2.
so 27th open-2 closed-1
same way 28th 3 tickets open and closed 1 from 3 and 1 remaining(on 27th)
so open-3 closed-2
- Mark as New
- Bookmark
- Subscribe
- Mute
- Subscribe to RSS Feed
- Permalink
- Report Inappropriate Content
in that case check the data once...
For those 7 tickets, the Trend_DT is NULL but the Trend_status is Close. That is the reason, why we are getting "-" instead of date in the lie chart as well.
If u don't want to showcase those records with Trend_DT is NULL, suppress those records.
- Mark as New
- Bookmark
- Subscribe
- Mute
- Subscribe to RSS Feed
- Permalink
- Report Inappropriate Content
Hi Suman,
To do that in straight Table Use a selection list box to select status and make your expression in straight table conditional
with Trend_Status='Open' and Trend_Status='Close'.
Regards,
Anjali
- « Previous Replies
- Next Replies »