Unlock a world of possibilities! Login now and discover the exclusive benefits awaiting you.
- Qlik Community
- :
- All Forums
- :
- QlikView App Dev
- :
- Re: show colums as dimension
- Subscribe to RSS Feed
- Mark Topic as New
- Mark Topic as Read
- Float this Topic for Current User
- Bookmark
- Subscribe
- Mute
- Printer Friendly Page
- Mark as New
- Bookmark
- Subscribe
- Mute
- Subscribe to RSS Feed
- Permalink
- Report Inappropriate Content
show colums as dimension
hello
i have table like this :
| employee_key | jan | feb | mar | apr | may | jun | jul | aug | sep | oct | nov | dec | year_salary |
| 1 | 1 | 0 | 0 | 0 | 0 | 1 | 1 | 1 | 1 | 1 | 1 | 1 | 40000 |
| 2 | 1 | 1 | 1 | 1 | 1 | 1 | 0 | 0 | 0 | 1 | 1 | 1 | 50000 |
| 3 | 0 | 1 | 1 | 0 | 0 | 0 | 1 | 1 | 1 | 1 | 1 | 0 | 20000 |
| 4 | 1 | 1 | 1 | 1 | 1 | 1 | 1 | 1 | 1 | 0 | 0 | 0 | 30000 |
i want to create chart
that show the data like this:
| month | count of employees |
| jan | 3 |
| feb | 3 |
| mar | 3 |
| apr | 2 |
| may | 1 |
| jun | 3 |
| jul | 3 |
| aug | 2 |
| sep | 4 |
| oct | 3 |
| nov | 3 |
| dec | 2 |
any suggestions??
nati
- Mark as New
- Bookmark
- Subscribe
- Mute
- Subscribe to RSS Feed
- Permalink
- Report Inappropriate Content
Try like this
- Mark as New
- Bookmark
- Subscribe
- Mute
- Subscribe to RSS Feed
- Permalink
- Report Inappropriate Content
CHECK enclosed file..
- Mark as New
- Bookmark
- Subscribe
- Mute
- Subscribe to RSS Feed
- Permalink
- Report Inappropriate Content
Hi,
See enclosed file,
It is as per your requirement.
Regards,
Please appreciate our Qlik community members by giving Kudos for sharing their time for your query. If your query is answered, please mark the topic as resolved 🙂
- Mark as New
- Bookmark
- Subscribe
- Mute
- Subscribe to RSS Feed
- Permalink
- Report Inappropriate Content
Hi Nati,
the required script for this task can be created with the crosstable wizard:
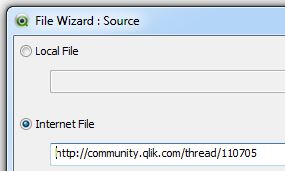
In the script editor import your example data like this

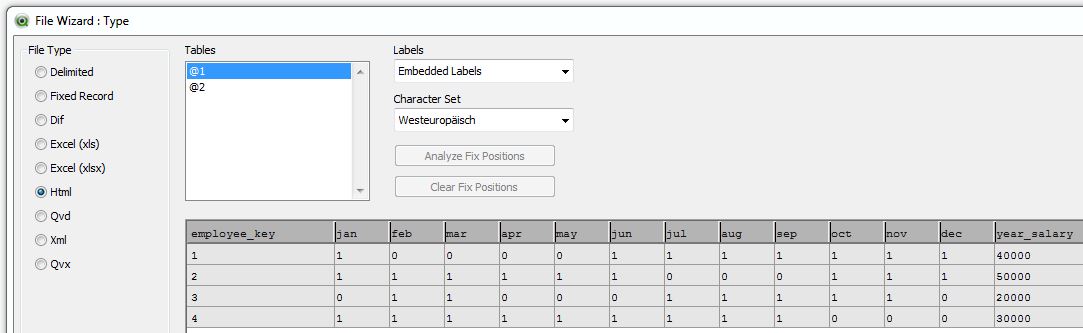
select the crosstable wizard here
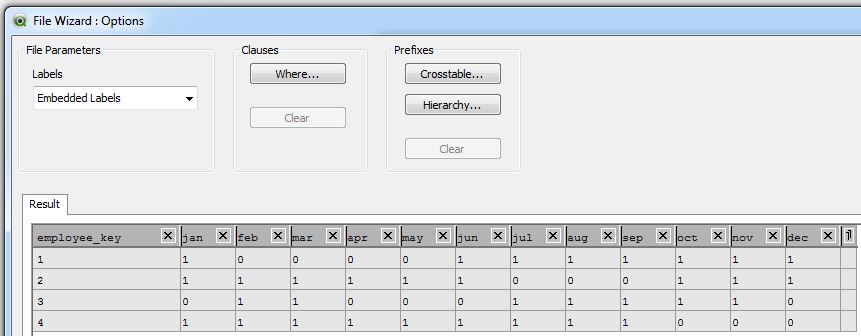
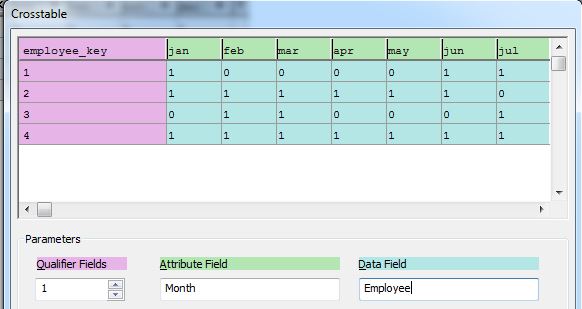
enter the field names and finish the import wizard.
you should get this script:
tabCrossTable:
CrossTable(Month, Employee)
LOAD employee_key,
     jan,
     feb,
     mar,
     apr,
     may,
     jun,
     jul,
     aug,
     sep,
     oct,
     nov,
     dec
FROM
[http://community.qlik.com/thread/110705]
(html, codepage is 1252, embedded labels, table is @1);
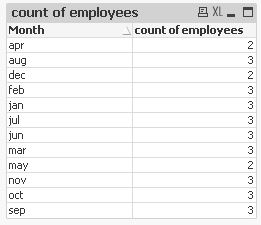
Afterwards you simply generate a table chart with the dimension "month" and expression "=sum(Employee)" named "count of employees".
The generated table should look like this:
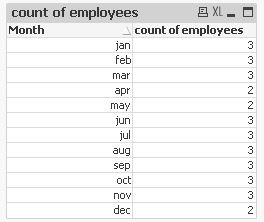
To correct the sorting of the month column (and the data type of the month field), you could add this code:
Left Join (tabCrossTable)
LOAD Distinct
  Month,
  Date#(Month, 'MMM') as Month2
Resident tabCrossTable;

DROP Field Month;
RENAME Field Month2 to Month;
afterwards your table should have changed into:
hope this helps
regards
Marco
- Mark as New
- Bookmark
- Subscribe
- Mute
- Subscribe to RSS Feed
- Permalink
- Report Inappropriate Content
thanke you all , you are very helping, i learned a lot about the crosstable option.
any way i wonder if there is a solution in the report level instead in script level
i have a big model with tables including milions of records and i am not sure that i want to duplicate large table
just for this report.
for this small report i prefer a solution in the report level and i dont care if it will takes a little longer to show him.
i have large 7 fact table in my complicated model and looking for creative way to solve this.
any suggestions?
thank you all
nati
- Mark as New
- Bookmark
- Subscribe
- Mute
- Subscribe to RSS Feed
- Permalink
- Report Inappropriate Content
Hi Nati,
there is another option indeed without changing the load script and data model.
Create a table chart with this calculated dimension:
=valuelist('jan', 'feb', 'mar', 'apr', 'may', 'jun', 'jul', 'aug', 'sep', 'oct', 'nov', 'dec')
and this expression:
=pick(match(valuelist('jan', 'feb', 'mar', 'apr', 'may', 'jun', 'jul', 'aug', 'sep', 'oct', 'nov', 'dec'), 'jan', 'feb', 'mar', 'apr', 'may', 'jun', 'jul', 'aug', 'sep', 'oct', 'nov', 'dec'),
sum(jan),
sum(feb),
sum(mar),
sum(apr),
sum(may),
sum(jun),
sum(jul),
sum(aug),
sum(sep),
sum(oct),
sum(nov),
sum(dec)
)
result looks the same
regards
Marco
- Mark as New
- Bookmark
- Subscribe
- Mute
- Subscribe to RSS Feed
- Permalink
- Report Inappropriate Content
thanke you marco, you are very helping,
i will try this
nati
- Mark as New
- Bookmark
- Subscribe
- Mute
- Subscribe to RSS Feed
- Permalink
- Report Inappropriate Content
You're welcome.
Please go ahead and close this thread, when there are no further questions.
thanks
regards
Marco