Unlock a world of possibilities! Login now and discover the exclusive benefits awaiting you.
- Qlik Community
- :
- All Forums
- :
- QlikView App Dev
- :
- Re: specific pivot feature
- Subscribe to RSS Feed
- Mark Topic as New
- Mark Topic as Read
- Float this Topic for Current User
- Bookmark
- Subscribe
- Mute
- Printer Friendly Page
- Mark as New
- Bookmark
- Subscribe
- Mute
- Subscribe to RSS Feed
- Permalink
- Report Inappropriate Content
specific pivot feature
hello everybody.
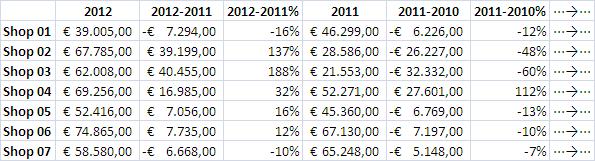
i have this data set: shops and their sales per year. i'd like to create a pivot chart showing the sales per shop/year AND the differences (absolute and percent) between consecutive years. see the followng image: image (Excel example):
thanx
- « Previous Replies
-
- 1
- 2
- Next Replies »
- Mark as New
- Bookmark
- Subscribe
- Mute
- Subscribe to RSS Feed
- Permalink
- Report Inappropriate Content
2012 =SUM( {<Year={2012}> Sales}
2012-2011 =SUM( {<Year={2012}> Sales} - SUM( {<Year={2011}> Sales}
2012-2011% =NUM( SUM( {<Year={2012}> Sales} / SUM( {<Year={2011}> Sales} - 1, '#,##0%')
.
.
.
you get the picture...
- Mark as New
- Bookmark
- Subscribe
- Mute
- Subscribe to RSS Feed
- Permalink
- Report Inappropriate Content
i shouldn't insert an expression for each year, it's meant to be dynamic and automatically do all the calculations for each year found in the data set. is it possible?
- Mark as New
- Bookmark
- Subscribe
- Mute
- Subscribe to RSS Feed
- Permalink
- Report Inappropriate Content
Yes, it's possible to do that. It will not look exactly like that, but I don't think it's an issue.
Add "Year" as dimension (drag it horizontally after) and create 3 expressions: Sales, Diff and Diff [%]
Sales: =SUM( Sales )
Diff: = this takes some time and I don't have it right now
Diff [%]:
You will get:
| 2012 | 2012 | 2012 | 2011 | 2011 | 2011 | |
|---|---|---|---|---|---|---|
| Store | Sales | Diff | Diff [%] | Sales | Diff | Diff [%] |
| Store 1 | ||||||
| Store 2 | ||||||
| Store 3 | ||||||
| Store 4 |
- Mark as New
- Bookmark
- Subscribe
- Mute
- Subscribe to RSS Feed
- Permalink
- Report Inappropriate Content
Hi Car,
The output you are looking for is quite possible and also it can be achievable as a dynamic one.
2012 (=Max(Year)) =SUM( {<Year={"=Max(Year)"}> Sales}
2012-2011 (= (Max(Year)-(Max(Year)-1) ) ) =SUM( {<Year={"=Max(Year)"}> Sales} - SUM( {<Year={"=Max(Year)-1"}> Sales}
2012-2011% (=(Max(Year)-(Max(Year)-1) )) % =NUM( SUM( {<Year={"=Max(Year)"}> Sales} / SUM( {<Year={"=Max(Year)-1"}> Sales} - 1, '#,##0%')
- Mark as New
- Bookmark
- Subscribe
- Mute
- Subscribe to RSS Feed
- Permalink
- Report Inappropriate Content
my Year dimension already is in a numeric format: is the syntax of the expressions you suggest ready for that?
- Mark as New
- Bookmark
- Subscribe
- Mute
- Subscribe to RSS Feed
- Permalink
- Report Inappropriate Content
UP! (???)
- Mark as New
- Bookmark
- Subscribe
- Mute
- Subscribe to RSS Feed
- Permalink
- Report Inappropriate Content
Please find below an application that try to solve your problem.
Sales columns have to be expression as you can not use your year dimension in the pivot table.
Please tell me if it is usefull or not.
Regards
Stéphane
- Mark as New
- Bookmark
- Subscribe
- Mute
- Subscribe to RSS Feed
- Permalink
- Report Inappropriate Content
very useful. now i just should get it dynamic, inserting each year from earliest to latest automatically in the pivot chart
- Mark as New
- Bookmark
- Subscribe
- Mute
- Subscribe to RSS Feed
- Permalink
- Report Inappropriate Content
please find below the application with dynamic set analysis
regards
stephane
- « Previous Replies
-
- 1
- 2
- Next Replies »