Unlock a world of possibilities! Login now and discover the exclusive benefits awaiting you.
- Qlik Community
- :
- All Forums
- :
- QlikView App Dev
- :
- stacked bar chart with one dimension
- Subscribe to RSS Feed
- Mark Topic as New
- Mark Topic as Read
- Float this Topic for Current User
- Bookmark
- Subscribe
- Mute
- Printer Friendly Page
- Mark as New
- Bookmark
- Subscribe
- Mute
- Subscribe to RSS Feed
- Permalink
- Report Inappropriate Content
stacked bar chart with one dimension
Hi everyone,
i had a requirement like need to display a bar chart in stacked format with one dimension like pyr_typ and expression like sum(rx_volume).
Is it possible to show bar chart in stacked format with one dimension.
please find the attached screenshot for your reference.
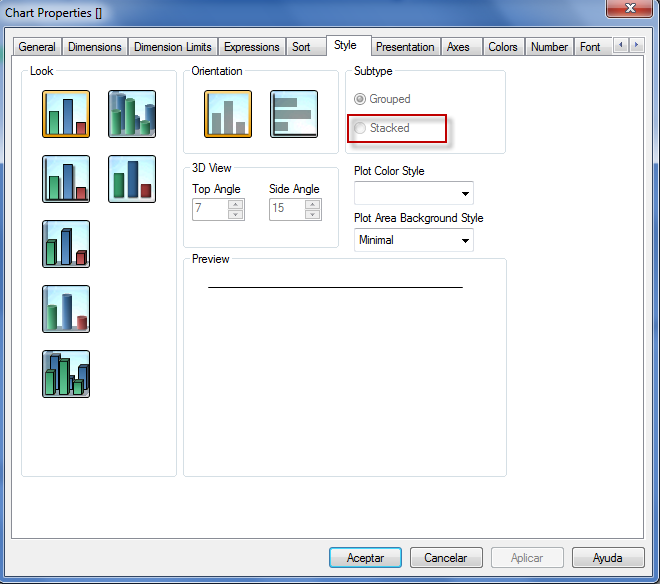
Please find also the attached qvw in which i tried to change Chart Properties > Style > Subtype > Stacked?
but it is not working
Thanks
Anu
Accepted Solutions
- Mark as New
- Bookmark
- Subscribe
- Mute
- Subscribe to RSS Feed
- Permalink
- Report Inappropriate Content
Because you have used Relative option here.
Untick Relative
Use below expression
Dual(Num(Sum(RX_VOLUME)/Sum(Total RX_VOLUME),'#0.00%')&'-'&PYR_TYP,Sum(RX_VOLUME))
Tick Values on Data Point
Go to Presentation Tab
Untick Show Legend
Tick plot value inside the segments
- Mark as New
- Bookmark
- Subscribe
- Mute
- Subscribe to RSS Feed
- Permalink
- Report Inappropriate Content
Hi Anu,
Have you tried Chart Properties > Style > Subtype > Stacked?

Regards,
H
- Mark as New
- Bookmark
- Subscribe
- Mute
- Subscribe to RSS Feed
- Permalink
- Report Inappropriate Content
Yes,
Go to the bar graph. Open properties->style. When you get there, you can choose stacked. It will be controlled by the expressions and not dimensions
- Mark as New
- Bookmark
- Subscribe
- Mute
- Subscribe to RSS Feed
- Permalink
- Report Inappropriate Content
You can't create a Stacked Bar Chart with One Dimension and One Expression.
You need either Two Dimensions or Two Expressions.
There is a workaround.
Check below link.
- Mark as New
- Bookmark
- Subscribe
- Mute
- Subscribe to RSS Feed
- Permalink
- Report Inappropriate Content
Hi Manish,
Thanks for the reply. Issue was resolved by following the link what you have sent.
But in the bar chart is there is any possibility to show the legend inside the chart like unk - 4.99%,mcare - 41.44%
please find the screen shot
- Mark as New
- Bookmark
- Subscribe
- Mute
- Subscribe to RSS Feed
- Permalink
- Report Inappropriate Content
Yes..
Dimension
1) =''
This is Calculated Dimension
2) Country
Change with your dimension
Expression
Dual(Num(Sum(Sales)/SUM(Total Sales),'#0.00%')&Chr(10)&Country,Sum(Sales)/SUM(Total Sales))
Change according to your need.
Sum(Sales)/SUM(Total Sales) with your expression
Country with your dimension
Tick Values on Data Point
Go to Presentation Tab and Untick Show Legend
Updated after Avinash's reply.
go to presentation tab
Tick plot value inside the segments
- Mark as New
- Bookmark
- Subscribe
- Mute
- Subscribe to RSS Feed
- Permalink
- Report Inappropriate Content
Try like this
go to presentation tab plot value inside the segments
- Mark as New
- Bookmark
- Subscribe
- Mute
- Subscribe to RSS Feed
- Permalink
- Report Inappropriate Content
hi manish,
i have tried the same but it is not working.
Please find the attachment.
Thanks
Anu
- Mark as New
- Bookmark
- Subscribe
- Mute
- Subscribe to RSS Feed
- Permalink
- Report Inappropriate Content
Try to create the same chart again. Delete the current chart and recreate it.
- Mark as New
- Bookmark
- Subscribe
- Mute
- Subscribe to RSS Feed
- Permalink
- Report Inappropriate Content
Because you have used Relative option here.
Untick Relative
Use below expression
Dual(Num(Sum(RX_VOLUME)/Sum(Total RX_VOLUME),'#0.00%')&'-'&PYR_TYP,Sum(RX_VOLUME))
Tick Values on Data Point
Go to Presentation Tab
Untick Show Legend
Tick plot value inside the segments