Unlock a world of possibilities! Login now and discover the exclusive benefits awaiting you.
- Qlik Community
- :
- All Forums
- :
- QlikView App Dev
- :
- Re: top 10 customers by their Invoice Amount
- Subscribe to RSS Feed
- Mark Topic as New
- Mark Topic as Read
- Float this Topic for Current User
- Bookmark
- Subscribe
- Mute
- Printer Friendly Page
- Mark as New
- Bookmark
- Subscribe
- Mute
- Subscribe to RSS Feed
- Permalink
- Report Inappropriate Content
top 10 customers by their Invoice Amount
Hi all ,
I am new to Qlik View and this forum as well .
I want to create a Bar Chart which shows top 10 customers by their InvoiceAmount .
Only i know is necessary Tables(SQL Server) from which i have to fetch data .
Now what should i write code so that Bar Code should come up with top 10 customer .
Please guide me .
Thanks .
Accepted Solutions
- Mark as New
- Bookmark
- Subscribe
- Mute
- Subscribe to RSS Feed
- Permalink
- Report Inappropriate Content
Dear Gautam,
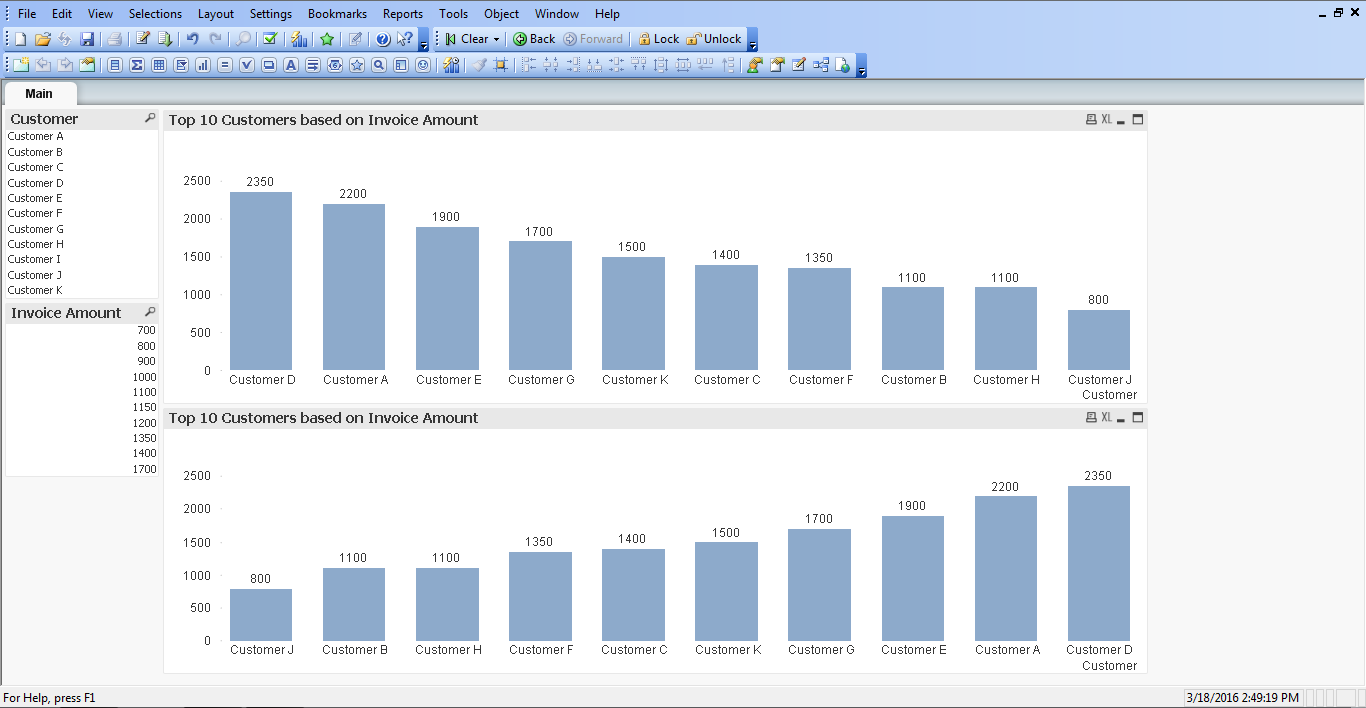
Kindly find attached App, I hope you are looking for that one.

Kind regards,
Ishfaque Ahmed
- Mark as New
- Bookmark
- Subscribe
- Mute
- Subscribe to RSS Feed
- Permalink
- Report Inappropriate Content
- Mark as New
- Bookmark
- Subscribe
- Mute
- Subscribe to RSS Feed
- Permalink
- Report Inappropriate Content
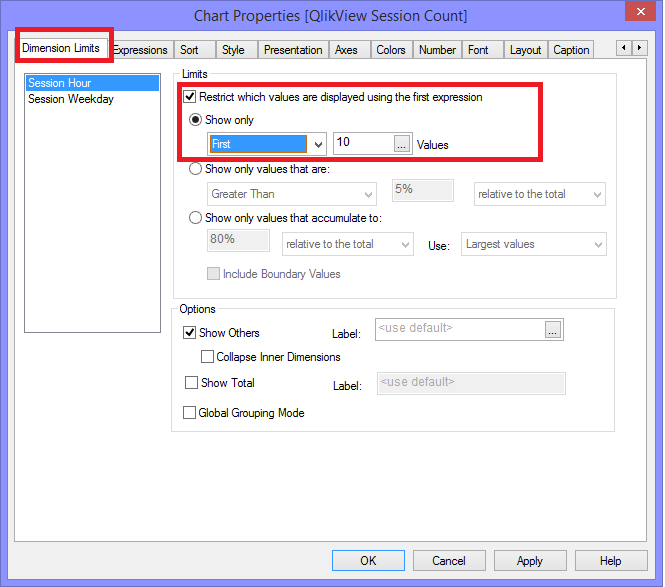
use the out of the box DimensionLimit tab
you can put top 10 and the 10 can be a variable

if your dimension is customer then select customer and choose the options as above
- Mark as New
- Bookmark
- Subscribe
- Mute
- Subscribe to RSS Feed
- Permalink
- Report Inappropriate Content
try this
Sum({<[Customer Name] = {"=Rank(SUM(TEUS))<=10"}>}TEUS)
or
Hi,
Try (Calulated Dimension)
Aggr(If(Rank(Expression) <= 10,Customer),Customer)
- Mark as New
- Bookmark
- Subscribe
- Mute
- Subscribe to RSS Feed
- Permalink
- Report Inappropriate Content
one easy way would be ..
1.Add the customers as the dimension
2.Add the expression as sum([invoice amount])
3.Go to dimension limits option the chart properties and select largest 10
4.click on finish
Now you the chart with the top 10 customers based on the invoice
- Mark as New
- Bookmark
- Subscribe
- Mute
- Subscribe to RSS Feed
- Permalink
- Report Inappropriate Content
Create the bar chart
Dimension : Customer
Expression : Sum(Invoice Amount)
Go to Dimension limit tab-> check restrict data->In show drop down select largest and put 5 in value
- Mark as New
- Bookmark
- Subscribe
- Mute
- Subscribe to RSS Feed
- Permalink
- Report Inappropriate Content
if it is stright table u will find dimension limit tab there u can restrict.
in pivot table u can use caluclated dimension as mentioned above![]()
- Mark as New
- Bookmark
- Subscribe
- Mute
- Subscribe to RSS Feed
- Permalink
- Report Inappropriate Content
I think Dimension limit tab is not available for version lower than 11 (I am not sure if you are using QV10). So, calculated dimension is always handy. You can try something like this in your dimension tab -> Add Calculated Dimension:
if(aggr(rank(sum(InvoiceAmount)), CustomerID) <= 10, CustomerID).
Also, please suppress NULL values for this calculated dimension.
Thanks!
- Mark as New
- Bookmark
- Subscribe
- Mute
- Subscribe to RSS Feed
- Permalink
- Report Inappropriate Content
Dear Gautam,
Kindly find attached App, I hope you are looking for that one.

Kind regards,
Ishfaque Ahmed
- Mark as New
- Bookmark
- Subscribe
- Mute
- Subscribe to RSS Feed
- Permalink
- Report Inappropriate Content
Hi Ahmed ,
Thanks for the App , it worked .