Unlock a world of possibilities! Login now and discover the exclusive benefits awaiting you.
- Qlik Community
- :
- All Forums
- :
- QlikView App Dev
- :
- two different year sales in a single bar
- Subscribe to RSS Feed
- Mark Topic as New
- Mark Topic as Read
- Float this Topic for Current User
- Bookmark
- Subscribe
- Mute
- Printer Friendly Page
- Mark as New
- Bookmark
- Subscribe
- Mute
- Subscribe to RSS Feed
- Permalink
- Report Inappropriate Content
two different year sales in a single bar
hello everyone
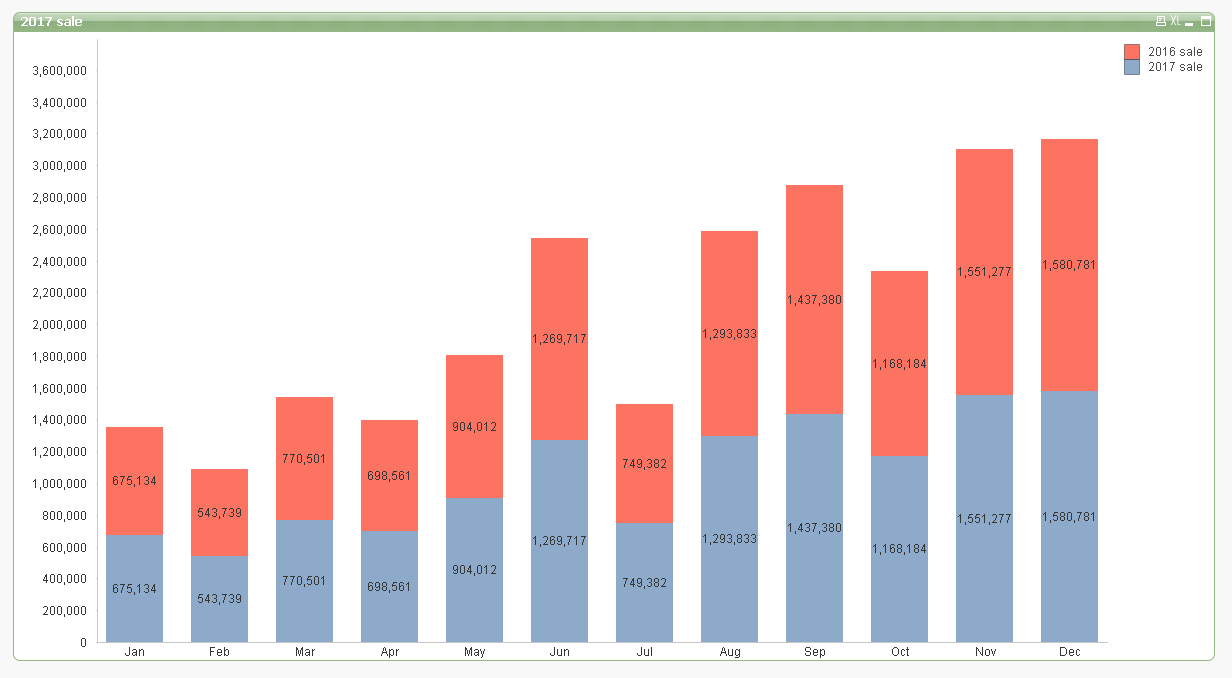
i need to show two different year sales data in a single bar in a bar chart like below. it shows sales value of April month of year 2016 & 2017. please help me to find out solution.
Thank you.
- « Previous Replies
-
- 1
- 2
- Next Replies »
- Mark as New
- Bookmark
- Subscribe
- Mute
- Subscribe to RSS Feed
- Permalink
- Report Inappropriate Content
Don't unique for single issue Different year value in a single bar with different color
- Mark as New
- Bookmark
- Subscribe
- Mute
- Subscribe to RSS Feed
- Permalink
- Report Inappropriate Content
still i am not getting proper solution. what should i do............
- Mark as New
- Bookmark
- Subscribe
- Mute
- Subscribe to RSS Feed
- Permalink
- Report Inappropriate Content
If you are not getting any response over here. that would you like to add one more thread with same issue ![]() ??
??
Anyway, We are showing our best. How come we know which live data you worked for. And what i proved in bar chart is the right approach. But, the data points are not clean and neat as we have limits in Qlikview. That's where i recommend someone who good ex-plainer. You have to wait till recommends response.
- Mark as New
- Bookmark
- Subscribe
- Mute
- Subscribe to RSS Feed
- Permalink
- Report Inappropriate Content
this doesn't fulfill you requirement ?

- Mark as New
- Bookmark
- Subscribe
- Mute
- Subscribe to RSS Feed
- Permalink
- Report Inappropriate Content
ya but it shows sale sales for both year and one thing i have data from 2000 to 2017
- Mark as New
- Bookmark
- Subscribe
- Mute
- Subscribe to RSS Feed
- Permalink
- Report Inappropriate Content
same sales
- Mark as New
- Bookmark
- Subscribe
- Mute
- Subscribe to RSS Feed
- Permalink
- Report Inappropriate Content
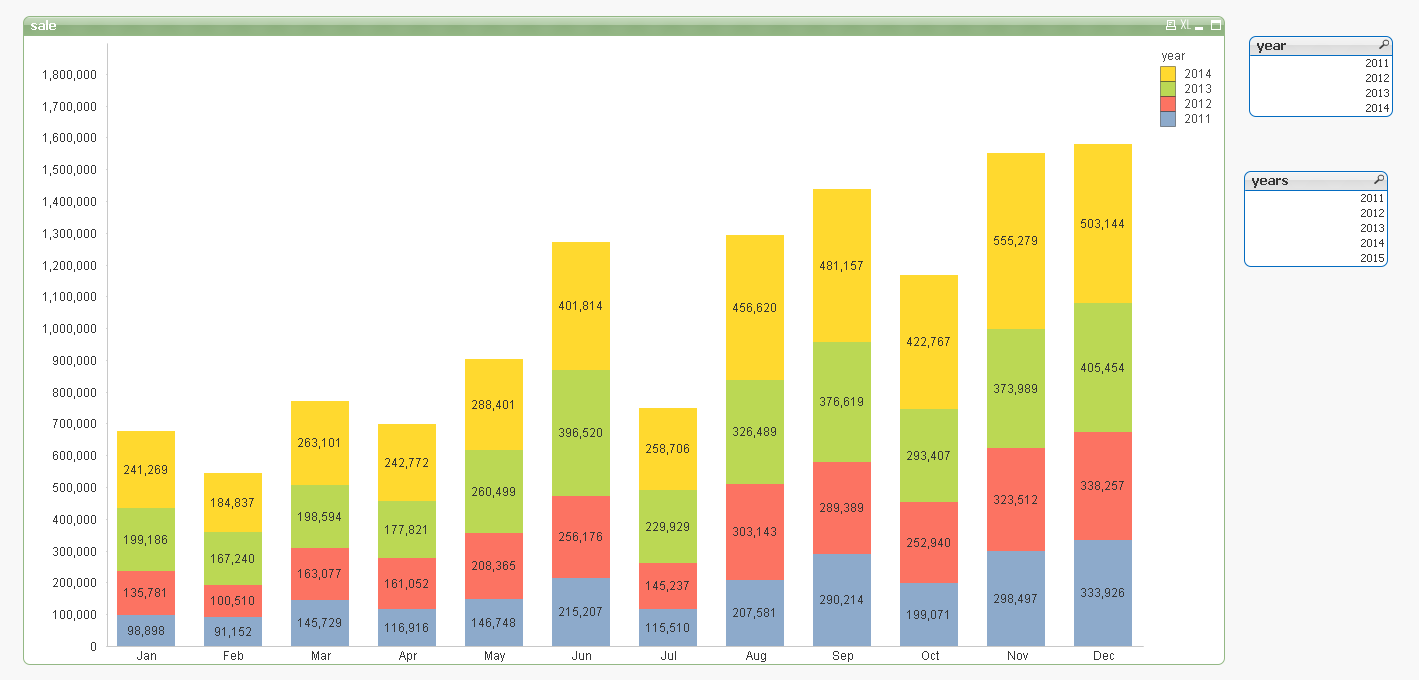
OK I see , that because your "year" field is in lower case and your expression is "Sum({<Year = {2017}>}Sales)" which will calculate wrongly.
how about this , I notice that we have data from 2011 to 2014 , not 2000 to 2017 , in addition ,your have a "years" field from 2011 to 2015 ,plz check

- Mark as New
- Bookmark
- Subscribe
- Mute
- Subscribe to RSS Feed
- Permalink
- Report Inappropriate Content
that was my dummy data, it was created only for posting on community
- Mark as New
- Bookmark
- Subscribe
- Mute
- Subscribe to RSS Feed
- Permalink
- Report Inappropriate Content
it is possible to give one more condition like category wise sales
- « Previous Replies
-
- 1
- 2
- Next Replies »