Unlock a world of possibilities! Login now and discover the exclusive benefits awaiting you.
- Qlik Community
- :
- All Forums
- :
- QlikView App Dev
- :
- Re: ytd-figures
- Subscribe to RSS Feed
- Mark Topic as New
- Mark Topic as Read
- Float this Topic for Current User
- Bookmark
- Subscribe
- Mute
- Printer Friendly Page
- Mark as New
- Bookmark
- Subscribe
- Mute
- Subscribe to RSS Feed
- Permalink
- Report Inappropriate Content
ytd-figures
Hi,
i hope somebody of you can help me.
I have a very tough Topic with year-to-date figures that I cannot solve.
I tried lots of things but nothing worked.
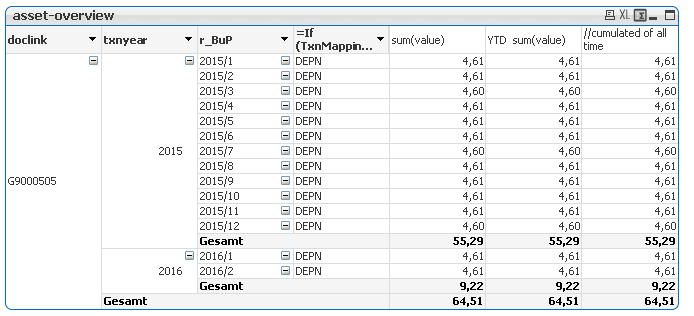
Here is my table:
I have an asset, which Shows me depreciation-period (column2), period in which the depreciation belongs (column3) and the depreciation-code (column4).
Now I Need to create for Management an Overview where I get the periodic value (this works ![]() ),
),
the cumulated YTD-Value and the cumulated value of all time.
(the sum-lines are just now included for better overwiew)

Example:
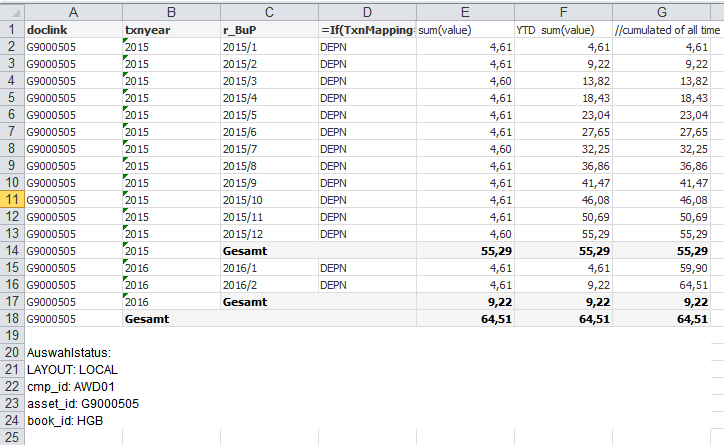
YTD sum (value) per 2015/2 should be 9,22 and as of 2015/12 it should be 55,29
YTD sum (value) per 2016/1 should be 4,61 and as of 2016/2 it should be 9,22
Now, the cumulated of all time is for 2015-periods like YTD sum(value)
2016/1 should have 59,90 and as of 2016/2 the should be 64,51.
This is the outcome that I wish to have:

I know that this is a tough Topic, there I attach the qvw.
Very much thanks in advance for your very urgently needed help ![]()
Chris
- Mark as New
- Bookmark
- Subscribe
- Mute
- Subscribe to RSS Feed
- Permalink
- Report Inappropriate Content
For your third expression try this:
If(Dimensionality() = 2 or Dimensionality() = 1, Sum(value), RangeSum(Above(TOTAL Sum(value), 0, RowNo(TOTAL))))
- Mark as New
- Bookmark
- Subscribe
- Mute
- Subscribe to RSS Feed
- Permalink
- Report Inappropriate Content
2nd Expression:
If(Dimensionality() = 2 or Dimensionality() = 1, Sum(value), RangeSum(Above(TOTAL Sum(value), 0, SubField(r_BuP, '/', 2))))
- Mark as New
- Bookmark
- Subscribe
- Mute
- Subscribe to RSS Feed
- Permalink
- Report Inappropriate Content
Hi sunny,
Thank you very much for your help so far. just have one last additional item to solve.
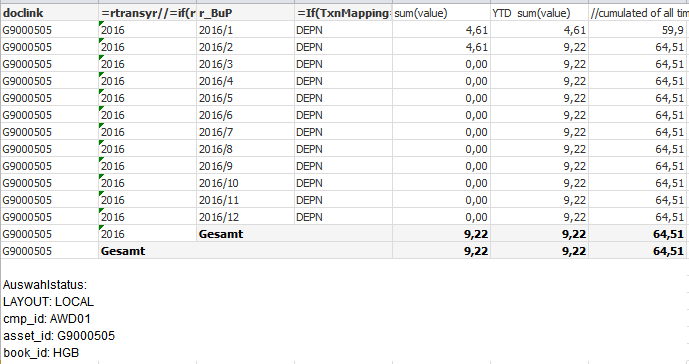
I Need to Show only my actual year. But for that all periods must be shown always (not matter which month in actual)
Naturally (because we only have two month so far) the table Shows only two lines and not twelve
But my Management wants to see it like this. Until February it is real data from database and beginning with march it is for periodic 0,00 and for the YTD-field and the cumulated field frozen data as of end of February.
I know that there is an above functionality but I dont know where to put this in your Formular.

Would you please help me once again?
I attach the qvw file again (with already correct filter in that table).
Thank you very much.
Chris
- Mark as New
- Bookmark
- Subscribe
- Mute
- Subscribe to RSS Feed
- Permalink
- Report Inappropriate Content
Are those dates even available in your application? unless you have them available in a master calendar or somewhere, there is no easy way to bring them into your chart.
- Mark as New
- Bookmark
- Subscribe
- Mute
- Subscribe to RSS Feed
- Permalink
- Report Inappropriate Content
Hi Sunny,
I know, it is very complicated. Therefore I integrated a master calendar.
But I did not get it to work.
Chris
- Mark as New
- Bookmark
- Subscribe
- Mute
- Subscribe to RSS Feed
- Permalink
- Report Inappropriate Content
Did you add the master calendar until max date or did you add it until the end of 2016?
- Mark as New
- Bookmark
- Subscribe
- Mute
- Subscribe to RSS Feed
- Permalink
- Report Inappropriate Content
I just Changed it to 31.12.2019.
- Mark as New
- Bookmark
- Subscribe
- Mute
- Subscribe to RSS Feed
- Permalink
- Report Inappropriate Content
I only see rtransyr up until 2016 Feb. Did you add future date into another date field?
- Mark as New
- Bookmark
- Subscribe
- Mute
- Subscribe to RSS Feed
- Permalink
- Report Inappropriate Content
Hi Sunny,
Sorry, but I am not really deep into that it-stuff.
the rtransper is only existing until period 2 of 2016.
but i have as datefield (not shown in the table) the txndate.
and in the calendar I put as max(txndate) = '31.12.2019' (varMAXDATUMfix)
To be honest, I am not really sure how exactly to deal in this table (fields, dimensions, etc.) to get the wished result.
I am flexible if you say we sure adapt something to get it work.
Chris