Unlock a world of possibilities! Login now and discover the exclusive benefits awaiting you.
- Qlik Community
- :
- All Forums
- :
- QlikView App Dev
- :
- 100% Stacked Bar Graph
- Subscribe to RSS Feed
- Mark Topic as New
- Mark Topic as Read
- Float this Topic for Current User
- Bookmark
- Subscribe
- Mute
- Printer Friendly Page
- Mark as New
- Bookmark
- Subscribe
- Mute
- Subscribe to RSS Feed
- Permalink
- Report Inappropriate Content
100% Stacked Bar Graph
Hello All
I have to build an Stacked Bar Graph where all bars sum 100%.
One dimention its, for instance, "months" and the other one is "Clients" and the expresion its a count of an specific item.
So, what i have to show its how participate each client on the total count for each month.
Let me ilustrate with an example table:
MONTH
CLIENT 1 2 3 4 TOTAL
X1 100 300 200 100 700
X2 350 300 100 150 900
X3 200 100 100 150 550
If i make an stacked bar graph abput this table, you will not see 100% bars. Will see 3 bars of diferents sizes based on Sum of quantities.
What i need are 3 100% bars based on participation.
Any help please????
Thanks for All
- « Previous Replies
-
- 1
- 2
- Next Replies »
Accepted Solutions
- Mark as New
- Bookmark
- Subscribe
- Mute
- Subscribe to RSS Feed
- Permalink
- Report Inappropriate Content
Use TOTAL <CLIENT> to make the values a percentage:
Sum(Amount)/Sum(TOTAL <CLIENT> Amount)
I've attached a sample using your provided data (but reformatted a bit, see the load).
- Mark as New
- Bookmark
- Subscribe
- Mute
- Subscribe to RSS Feed
- Permalink
- Report Inappropriate Content
Use TOTAL <CLIENT> to make the values a percentage:
Sum(Amount)/Sum(TOTAL <CLIENT> Amount)
I've attached a sample using your provided data (but reformatted a bit, see the load).
- Mark as New
- Bookmark
- Subscribe
- Mute
- Subscribe to RSS Feed
- Permalink
- Report Inappropriate Content
I tested and it WORKED!!!! MANY THANKS!!!!
- Mark as New
- Bookmark
- Subscribe
- Mute
- Subscribe to RSS Feed
- Permalink
- Report Inappropriate Content
Hi!
I want to do the same thing but I have a problem. Instead of the variable 'Amount' I have 'Cost' but not as a one short expression but as something like this:
(sum(EfCost*if(EfCurrency='ARS',1,0))*sum(if(XchangeMoneda='ARS',XchangeCotización,0))/sum(if(XchangeMoneda='ARS',1,0))
+sum(EfCost*if(EfCurrency='BRL',1,0))*sum(if(XchangeMoneda='BRL',XchangeCotización,0))/sum(if(XchangeMoneda='BRL',1,0))
+sum(EfCost*if(EfCurrency='USD',1,0)))
The problem is that the Cost comes in dfferent currencies, so with this I take it to USD. If I use the same formula for the stacked 100% with this expression I have an Error. This is waht I'm doing:
=
(sum(EfCost*if(EfCurrency='ARS',1,0))*sum(if(XchangeMoneda='ARS',XchangeCotización,0))/sum(if(XchangeMoneda='ARS',1,0))
+sum(EfCost*if(EfCurrency='BRL',1,0))*sum(if(XchangeMoneda='BRL',XchangeCotización,0))/sum(if(XchangeMoneda='BRL',1,0))
+sum(EfCost*if(EfCurrency='USD',1,0)))
/
sum(total <Reserva.Fecha>
(sum(EfCost*if(EfCurrency='ARS',1,0))*sum(if(XchangeMoneda='ARS',XchangeCotización,0))/sum(if(XchangeMoneda='ARS',1,0))
+sum(EfCost*if(EfCurrency='BRL',1,0))*sum(if(XchangeMoneda='BRL',XchangeCotización,0))/sum(if(XchangeMoneda='BRL',1,0))
+sum(EfCost*if(EfCurrency='USD',1,0)))
)
Any ideas??
- Mark as New
- Bookmark
- Subscribe
- Mute
- Subscribe to RSS Feed
- Permalink
- Report Inappropriate Content
I have to create a chart where each bar equals to 100%... (eg. if there is A,B,C then A=50%, B=30% , C=20%)...Please advise... I have tried using relative, but it does not work
- Mark as New
- Bookmark
- Subscribe
- Mute
- Subscribe to RSS Feed
- Permalink
- Report Inappropriate Content
What would the syntax be if you have 2 dimensions in your graph? For example, I also have time period (which is the x-axis).
Thanks.
- Mark as New
- Bookmark
- Subscribe
- Mute
- Subscribe to RSS Feed
- Permalink
- Report Inappropriate Content
Try using a Mekko Chart for this.
- Mark as New
- Bookmark
- Subscribe
- Mute
- Subscribe to RSS Feed
- Permalink
- Report Inappropriate Content
Thanks Dennis - I've tried doing this but it seems to aggregate everything and provide %'s across all bars.
What I want is the % to be 100% for each individual bar and want this value to appear within the segments.
Attached is what I currently have.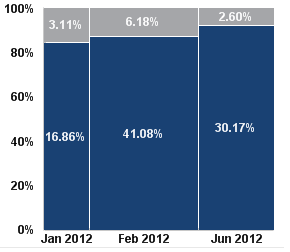
- Mark as New
- Bookmark
- Subscribe
- Mute
- Subscribe to RSS Feed
- Permalink
- Report Inappropriate Content
Hello,
How can I show percentages on the x-axis? In other words, what is the percentage of each of Jan 2012, Feb 2012 and Jun 2012, where the total adds to a 100%?
Thanks
- Mark as New
- Bookmark
- Subscribe
- Mute
- Subscribe to RSS Feed
- Permalink
- Report Inappropriate Content
I too would like to be able to create a 100% stacked bar chart showing percentages, side by side. I tried the above solution, but it took the percentage of the total, instead of grouping it by what is displayed on the x axis. Any ideas? I understand a Mekko chart will visually do this - but I would prefer to have an offical chart with equal widths along the x axis.
Amended - this does it... =sum(Value)/sum(Total<DateMonth> Value)
- « Previous Replies
-
- 1
- 2
- Next Replies »