Unlock a world of possibilities! Login now and discover the exclusive benefits awaiting you.
- Qlik Community
- :
- All Forums
- :
- QlikView App Dev
- :
- Re: 2 questions on Trellis Charts
- Subscribe to RSS Feed
- Mark Topic as New
- Mark Topic as Read
- Float this Topic for Current User
- Bookmark
- Subscribe
- Mute
- Printer Friendly Page
- Mark as New
- Bookmark
- Subscribe
- Mute
- Subscribe to RSS Feed
- Permalink
- Report Inappropriate Content
2 questions on Trellis Charts
Hi all!
I just started playing with trellis charts a few days ago and have a couple of questions I couldn't find the answers to in the community:
1) Can I add a chart that shows the totals for the dimension I'm breaking into separate charts with the Trellis??
For example, see this (dummy data, 'hand drawn') chart with # of newsletter subscribers by territory.
I'd like to have the 4 quadrant show the total subscribers of all territories put together. Can that be done?
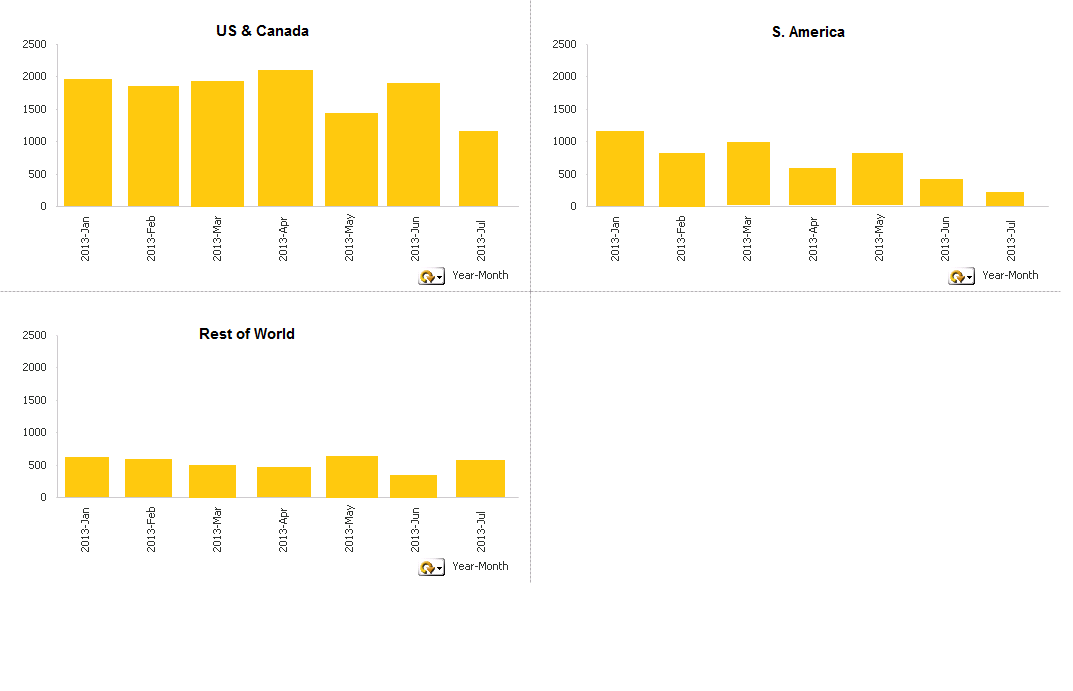
2) Can I have different axes scales for the different charts? As you can see, Rest of World could safely have vertical axis that max at 1000.
Thanks in advance! 
- Mark as New
- Bookmark
- Subscribe
- Mute
- Subscribe to RSS Feed
- Permalink
- Report Inappropriate Content
Hi,
As per my knowledge, Trellis chart, Making the itteration of charts by using the dimension. Here you are splitting them based on dimension values. Again you are showing total, that not other than normal view.
The scale may be depend on your values. I am not clear you got correct answer from my side. I shared what i know.
Regards,
Khadeer
- Mark as New
- Bookmark
- Subscribe
- Mute
- Subscribe to RSS Feed
- Permalink
- Report Inappropriate Content
1) For your territories dimension enable show total on the Dimension Limits tab of properties.
2) The point of the trellis chart is to compare, thus the option for individual scales have not been implemented.
- Mark as New
- Bookmark
- Subscribe
- Mute
- Subscribe to RSS Feed
- Permalink
- Report Inappropriate Content
Hi Johan,
Thanks for answering!
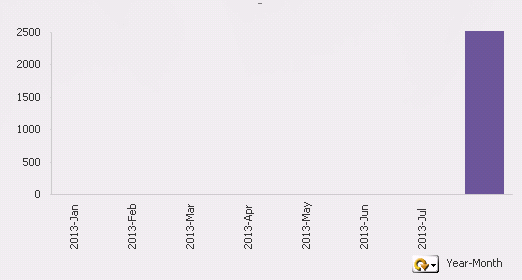
1. It doesn't work. What it does is indeed add a 4th quadrant but all it does is show one tall bar at the rightmost of the horizontal axis and no values at all for months.
2. Makes (some) sense
Thanks again!
- Mark as New
- Bookmark
- Subscribe
- Mute
- Subscribe to RSS Feed
- Permalink
- Report Inappropriate Content
anyone ? 
- Mark as New
- Bookmark
- Subscribe
- Mute
- Subscribe to RSS Feed
- Permalink
- Report Inappropriate Content
1. Yes, create a new dimension in the script:
Load * inline [
TrellisRegion, Region
US & Canada, US & Canada
S. America, S. America
Rest of World, Rest of World,
Total, US & Canada
Total, S. America
Total, Rest of World
];
Now use the field TrellisRegion as dimension instead of Region in your chart as first dimension.
2. No, all subcharts in the trellis will get the same axis scale. The alternative is to create separate charts that each can have their own scale.
talk is cheap, supply exceeds demand
- Mark as New
- Bookmark
- Subscribe
- Mute
- Subscribe to RSS Feed
- Permalink
- Report Inappropriate Content
Hi,
Thanks a lot!
I tried it but got a garbage after statement error
(the names of the field and the values are a bit different in this model)
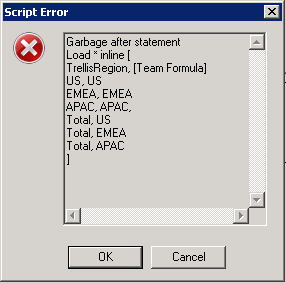
any ideas what i'm doing wrong?
Thanks!
- Mark as New
- Bookmark
- Subscribe
- Mute
- Subscribe to RSS Feed
- Permalink
- Report Inappropriate Content
Hi
Try like this
Load * inline
[
TrellisRegion, "Team Formula"
US, US
..
];
Please close the thread by marking correct answer & give likes if you like the post.