Unlock a world of possibilities! Login now and discover the exclusive benefits awaiting you.
- Qlik Community
- :
- All Forums
- :
- QlikView App Dev
- :
- Re: 3 Dimension Coloring
- Subscribe to RSS Feed
- Mark Topic as New
- Mark Topic as Read
- Float this Topic for Current User
- Bookmark
- Subscribe
- Mute
- Printer Friendly Page
- Mark as New
- Bookmark
- Subscribe
- Mute
- Subscribe to RSS Feed
- Permalink
- Report Inappropriate Content
3 Dimension Coloring
Hi,
I've been working with Qlikview and I'm struggling on my current scenario.
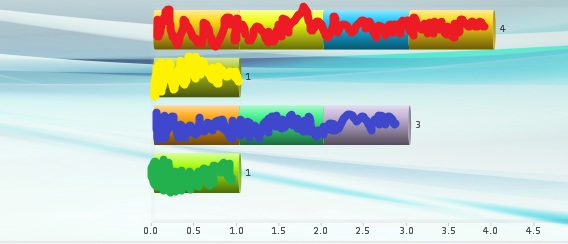
I have this graph counting the number of employees for a certain team. I also have 3 dimensions, consists of the skill, the team and a calculated field which returns an employee count if it's knowledge is program or function.


I want to have the color in team rather than in employees. Can you help me out here?
THANKS A LOT!
- Mark as New
- Bookmark
- Subscribe
- Mute
- Subscribe to RSS Feed
- Permalink
- Report Inappropriate Content
Can you explain little more, Question was satisfied but we are not sure how we can answer and where you need this?
- Mark as New
- Bookmark
- Subscribe
- Mute
- Subscribe to RSS Feed
- Permalink
- Report Inappropriate Content
Hi Anil,
All I want is to make the color on the dimension be on the Team rather than per Employee.
- Mark as New
- Bookmark
- Subscribe
- Mute
- Subscribe to RSS Feed
- Permalink
- Report Inappropriate Content
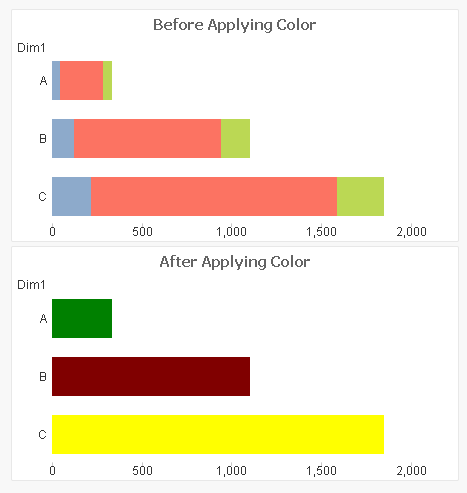
Just to make it simple.
Instead of the first picture. I want it to be like this:
First team is Red, then second team is yellow, 3rd is blue... etc.
rather than having a different colors per team.
I hope this will help you out.
- Mark as New
- Bookmark
- Subscribe
- Mute
- Subscribe to RSS Feed
- Permalink
- Report Inappropriate Content
This may useful some what? But please share sample application to test
- Mark as New
- Bookmark
- Subscribe
- Mute
- Subscribe to RSS Feed
- Permalink
- Report Inappropriate Content
I'm working on a prototype.
- Mark as New
- Bookmark
- Subscribe
- Mute
- Subscribe to RSS Feed
- Permalink
- Report Inappropriate Content
Like this? By, This is not make sense to me how USER can analyze over measures
- Mark as New
- Bookmark
- Subscribe
- Mute
- Subscribe to RSS Feed
- Permalink
- Report Inappropriate Content
Like what I've shown on my screenshot. I have 3 dimensions with 1 calculated fields and an expression of counting the distinct name of employees for each team. Now, I need the one that you've sent because the color was always pointing on the employees.
For example, If 100 employees are on Team A then, Team A bar graph will have 100 different colors... If 500 employees are on Team B then likewise, Team B bar graph will have 500 different colors grouped, which is not what I want.
I hope I make my self clear on my issues here.
- Mark as New
- Bookmark
- Subscribe
- Mute
- Subscribe to RSS Feed
- Permalink
- Report Inappropriate Content
may be,
in Color by Expression,
You can use something like,
pick(rank(TeamFieldname),red(),yellow(),blue(),green(),lightgray(),magenta())