Unlock a world of possibilities! Login now and discover the exclusive benefits awaiting you.
- Qlik Community
- :
- All Forums
- :
- QlikView App Dev
- :
- 3 Month Rolling
- Subscribe to RSS Feed
- Mark Topic as New
- Mark Topic as Read
- Float this Topic for Current User
- Bookmark
- Subscribe
- Mute
- Printer Friendly Page
- Mark as New
- Bookmark
- Subscribe
- Mute
- Subscribe to RSS Feed
- Permalink
- Report Inappropriate Content
3 Month Rolling
Hi All,
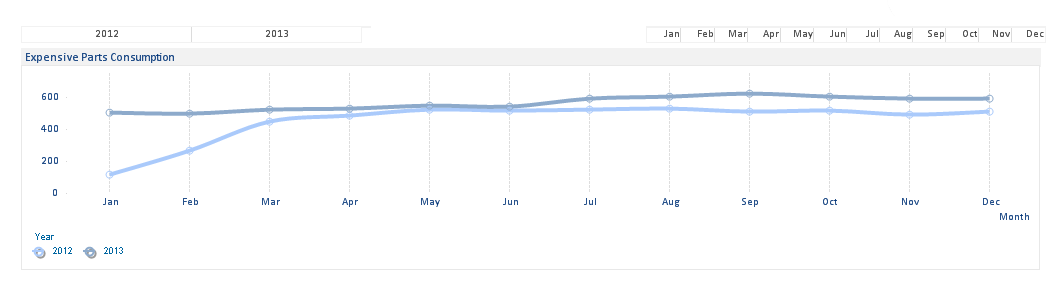
I have a combo chart and Year and Month as dimensions.
I have written the following expression:
sum({<Month={'>=$(=max(Month)-2)<=$(=max(Month))'}>}aggr(rangesum(below(total sum({<Month=>}Consumption),0,3)),Month))
The expression is working fine but it is showing only value in chart. Attached image for reference.
Can you please tell me where i am doing wrong.
Thanks,
Bharat
- « Previous Replies
- Next Replies »
Accepted Solutions
- Mark as New
- Bookmark
- Subscribe
- Mute
- Subscribe to RSS Feed
- Permalink
- Report Inappropriate Content
May be try this
=Only({<Consumption = {"*"}>} Aggr(RangeSum(Above(Sum({<Month, [Month-Year], MonthYear, Year>}Consumption), 0, 3)), [Month-Year]))
- Mark as New
- Bookmark
- Subscribe
- Mute
- Subscribe to RSS Feed
- Permalink
- Report Inappropriate Content
1) Have you made selection in year field?
2) What makes you say that the expression is working fine? Is the number that shows up for 2012 is the number you expect to see?
3) Do you expect to see all the years? or what is wrong here?
- Mark as New
- Bookmark
- Subscribe
- Mute
- Subscribe to RSS Feed
- Permalink
- Report Inappropriate Content
Sunny Bhai if i made any selection in year and month the value is showing correct.
I mean if i select any year for example 2012 and Mar month the value is showing fine.
But when i don't filter anything i am getting 2012 dec month by default..
I would like to show last 3 months by default and when i filter based on year and month the graph should change.
Please let me know if you need anything Sunny Bhai..
- Mark as New
- Bookmark
- Subscribe
- Mute
- Subscribe to RSS Feed
- Permalink
- Report Inappropriate Content
I think you might need to use MonthYear field in your aggr function... something like this
Sum({<Month = {">=$(=max(Month)-2)<=$(=max(Month))"}>} Aggr(RangeSum(Below(TOTAL Sum({<Month>} Consumption), 0, 3)), MonthYearField))
- Mark as New
- Bookmark
- Subscribe
- Mute
- Subscribe to RSS Feed
- Permalink
- Report Inappropriate Content
Now i am getting for all months one one value Sunny Bhai.
Because of application size i am keeping for one year.
Request you to find the attached file and let me know what i need to do
Thanks
- Mark as New
- Bookmark
- Subscribe
- Mute
- Subscribe to RSS Feed
- Permalink
- Report Inappropriate Content
Would you be able to also let us know what needs to be the output based on selection and without selection?
- Mark as New
- Bookmark
- Subscribe
- Mute
- Subscribe to RSS Feed
- Permalink
- Report Inappropriate Content
Sunny Bhai,
By default it should show last 3 months rolling without selection.
And if i select any month and month or year based on those selections the graphs should change. And all the time only 3 graphs should be there.
Please let me know if you need anything more.
- Mark as New
- Bookmark
- Subscribe
- Mute
- Subscribe to RSS Feed
- Permalink
- Report Inappropriate Content
Make sense, but what does this translate to in numbers based on the sample provided 
- Mark as New
- Bookmark
- Subscribe
- Mute
- Subscribe to RSS Feed
- Permalink
- Report Inappropriate Content
Sunny Bhai.. Please find the attached qvw.
Here i have two years of data 2012 and 2013
now in 2012 Jan value is 120 and Feb value is 148 and Mar value is 180.
Now in 2012(whether it is selected or even though if it is not selectd) the values should be Jan value as 120 and feb value as Jan+Feb 120+148=268 and Mar value should be i.e Jan+Feb+Mar 448 and for april it should be Feb+Mar+april= 489 and the same applies till December.
Now we have 2013 and 2013 jan value will be 2012 Nov 170 + 2012 Dec 172+ 2013 Jan 163 i.e 505 i need to get for 2013 Jan and same goes till rest for all the months.
Kindly check the attached qvw and let me know anything if you need Sunny Bhai
Thanks,
Bharat
- Mark as New
- Bookmark
- Subscribe
- Mute
- Subscribe to RSS Feed
- Permalink
- Report Inappropriate Content
Try this
=Aggr(RangeSum(Above(Sum({<Month, [Month-Year], MonthYear, Year>}Consumption), 0, 3)), [Month-Year])
- « Previous Replies
- Next Replies »