Unlock a world of possibilities! Login now and discover the exclusive benefits awaiting you.
- Qlik Community
- :
- All Forums
- :
- QlikView App Dev
- :
- A different chart
Options
- Subscribe to RSS Feed
- Mark Topic as New
- Mark Topic as Read
- Float this Topic for Current User
- Bookmark
- Subscribe
- Mute
- Printer Friendly Page
Turn on suggestions
Auto-suggest helps you quickly narrow down your search results by suggesting possible matches as you type.
Showing results for
Not applicable
2012-02-20
10:01 AM
- Mark as New
- Bookmark
- Subscribe
- Mute
- Subscribe to RSS Feed
- Permalink
- Report Inappropriate Content
A different chart
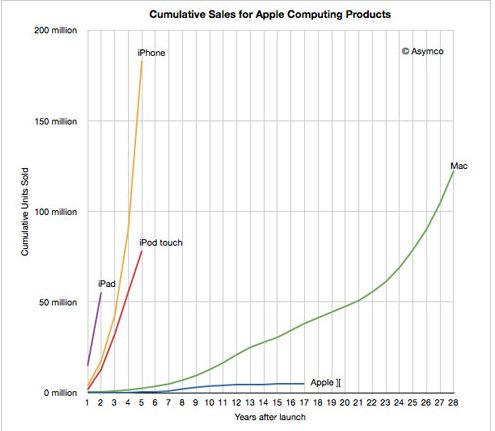
How would you do this chart?
473 Views
3 Replies
Luminary Alumni
2012-02-20
10:26 AM
- Mark as New
- Bookmark
- Subscribe
- Mute
- Subscribe to RSS Feed
- Permalink
- Report Inappropriate Content
Hi,
Can you attach the sample data.
Regards,
Jagan.
140 Views
Not applicable
2012-02-20
11:10 AM
Author
- Mark as New
- Bookmark
- Subscribe
- Mute
- Subscribe to RSS Feed
- Permalink
- Report Inappropriate Content
Product | First Year Sale | Years | Amount |
| A | 2000 | 12 | 100.000 |
| B | 1999 | 13 | 200.000 |
| C | 1992 | 20 | 185.000 |
| D | 2005 | 7 | 150.000 |
| E | 2001 | 11 | 250.000 |
Like this????
140 Views
Luminary Alumni
2012-02-21
12:45 AM
- Mark as New
- Bookmark
- Subscribe
- Mute
- Subscribe to RSS Feed
- Permalink
- Report Inappropriate Content
Hi,
Please check the attachment, not able to reproduce exactly same as you required. But hope it helps you.
Regards,
Jagan.
140 Views