Unlock a world of possibilities! Login now and discover the exclusive benefits awaiting you.
- Qlik Community
- :
- All Forums
- :
- QlikView App Dev
- :
- Accumulation in charts
- Subscribe to RSS Feed
- Mark Topic as New
- Mark Topic as Read
- Float this Topic for Current User
- Bookmark
- Subscribe
- Mute
- Printer Friendly Page
- Mark as New
- Bookmark
- Subscribe
- Mute
- Subscribe to RSS Feed
- Permalink
- Report Inappropriate Content
Accumulation in charts
Hello,
I have an issue regarding a chart. It's about accumulation values. (see the picture )
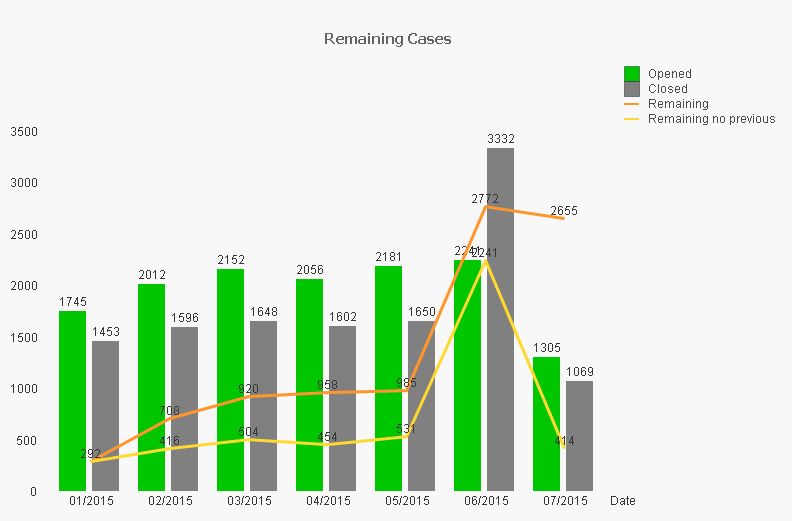
In this chart I have, opened cases, closed cases and remaining cases. The orange line is remaining cases with Accumulation = 2 and the yellow line is with no accumulation.
My goal values are these: (the formula is Opened Cases + Remaining cases from previous month - closed cases)
01/2015 = 292;
02/2015 = 2012 + 292 - 1596 =708;
03/2015 = 2152 + 708 - 1648 = 1212;
04/2015 = 2056 + 1212 - 1602 = 1666;
05/2015 = 2181 + 1666 - 1650 = 2197;
06/2015 = 2241 + 2197 - 3332 = 1106;
07/2015 = 1305 + 1106 - 1069 = 1342;
You can see that for the first two months the values are correct.
I've tried with full accumulation but the values after 05/2015 are wrong.
Can you give me an idea how can I do this ?
Thanks !
- Mark as New
- Bookmark
- Subscribe
- Mute
- Subscribe to RSS Feed
- Permalink
- Report Inappropriate Content
Hi,
Can u attach the qvw file it will be easy to help you out.
- Mark as New
- Bookmark
- Subscribe
- Mute
- Subscribe to RSS Feed
- Permalink
- Report Inappropriate Content
Hi
try with accumulation=7