Unlock a world of possibilities! Login now and discover the exclusive benefits awaiting you.
- Qlik Community
- :
- All Forums
- :
- QlikView App Dev
- :
- Re: Accumulation of values over dynamic time range...
- Subscribe to RSS Feed
- Mark Topic as New
- Mark Topic as Read
- Float this Topic for Current User
- Bookmark
- Subscribe
- Mute
- Printer Friendly Page
- Mark as New
- Bookmark
- Subscribe
- Mute
- Subscribe to RSS Feed
- Permalink
- Report Inappropriate Content
Accumulation of values over dynamic time ranges
Hi all,
Any suggestions on how to solve following issue in QlikView report?
- My data consists of bank account movements
- The account balance at a certain date is the accumulated sum of all movements to that date
- I want to display the account balance in a line chart AND I want the user to be able to select any date ranges
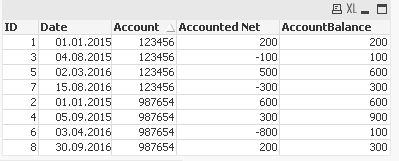
Data Sample:
| Date | Year | Month | Day | Period | Account | Accounted Net |
|---|---|---|---|---|---|---|
| 01.01.2015 | 2015 | 01 | 01 | 2015-01 | 123456 | 200 |
| 01.01.2015 | 2015 | 01 | 01 | 2015-01 | 987654 | 600 |
| 04.08.2015 | 2015 | 08 | 04 | 2015-08 | 123456 | -100 |
| 05.09.2015 | 2015 | 09 | 05 | 2015-09 | 987654 | 300 |
| 02.03.2016 | 2016 | 03 | 02 | 2016-03 | 123456 | 500 |
| 03.04.2016 | 2016 | 04 | 03 | 2016-04 | 987654 | -800 |
| 15.08.2016 | 2016 | 08 | 15 | 2016-08 | 123456 | -300 |
| 30.09.2016 | 2016 | 09 | 30 | 2019-09 | 987654 | 200 |
And ideas on how to calculate the account balance and display it in a bar chart. Important is that if the user chooses to look at 2016 figures the balance calculation has to include the movement in 2015 to end up with the right values.
Best regards,
Tim
- Mark as New
- Bookmark
- Subscribe
- Mute
- Subscribe to RSS Feed
- Permalink
- Report Inappropriate Content
Would you be able to share the expected output from your current sample?
- Mark as New
- Bookmark
- Subscribe
- Mute
- Subscribe to RSS Feed
- Permalink
- Report Inappropriate Content
Hi,
one solution might be:
tabAccountMovements:
LOAD RecNo() as ID,
    Date#(Date,'DD.MM.YYYY') as Date,
    Account,
    [Accounted Net]
FROM [https://community.qlik.com/thread/236590] (html, codepage is 1252, embedded labels, table is @1);

Left Join (tabAccountMovements)
LOAD ID,
    If(Account=Previous(Account),Peek(AccountBalance)+[Accounted Net],[Accounted Net]) as AccountBalance
Resident tabAccountMovements
Order By Account, Date, ID;
hope this helps
regards
Marco
- Mark as New
- Bookmark
- Subscribe
- Mute
- Subscribe to RSS Feed
- Permalink
- Report Inappropriate Content
Hi Sunny, thanks for your reply!
I tried to create my expected output for the sample data in Excel. Hope that makes it somewhat clearer.
When finished, I want to give the user the opportunity to switch between dimension so that the data is best represented for the time frame they choose (e.g. several years vs. one week). For representation purposes I choose the period dimension.
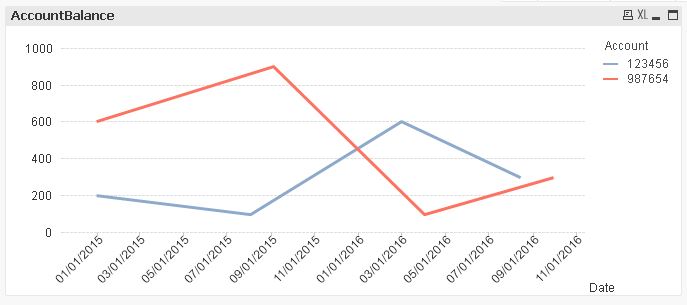
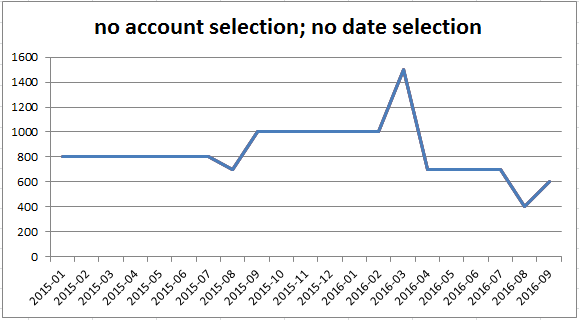
1) If nothing is selected I would like to see the balance movement for both accounts over the complete date range. Similar to this:
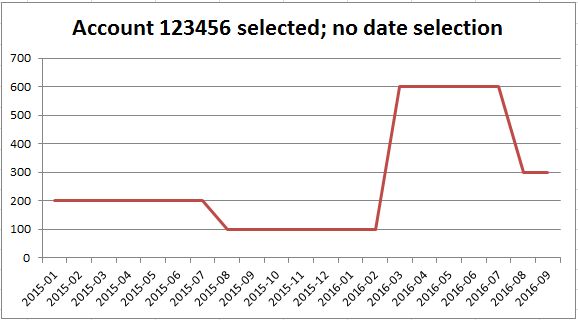
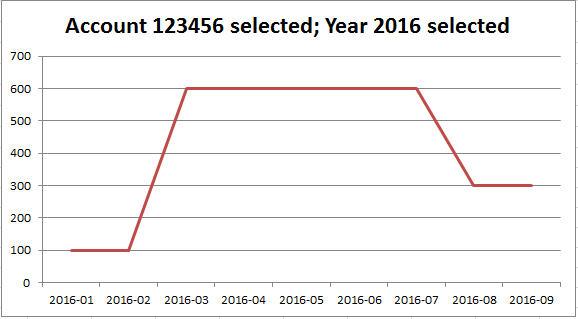
2) If i know select an account I would like to see this (example 123456):
3) And if I know choose to add a date selection I want to see the following (exapme 2016):
Hope that clarifies what I am trying to achieve.
Thanks for your help!
- Mark as New
- Bookmark
- Subscribe
- Mute
- Subscribe to RSS Feed
- Permalink
- Report Inappropriate Content
Hi Marco,
thanks a lot for your idea. To be honest I haven't considered loading the balances in the script yet. I was hoping to solve this issue in the App itself rather than in the load. But if the load is the only option I am open to change the script.
If you look at my reply to Sunny above you see that I would like the account balances to be steady as long as they are steady. Your proposal suggests account movements between the periods even though nothing happens.
Furthermore, in the real data there are several movements on every single day. And if the dimension is period as above or even year there would be thousands of movements in a period or year. The formula SUM(AccountBalance) would overstate the real account balance in this case. The MAX function wouldn't work if the account balance is decreasing over the day/period/year and the MIN function wouldn't work vice versa.
Do you have any more ideas on how to adjust the approach?
Thanks!
- Mark as New
- Bookmark
- Subscribe
- Mute
- Subscribe to RSS Feed
- Permalink
- Report Inappropriate Content
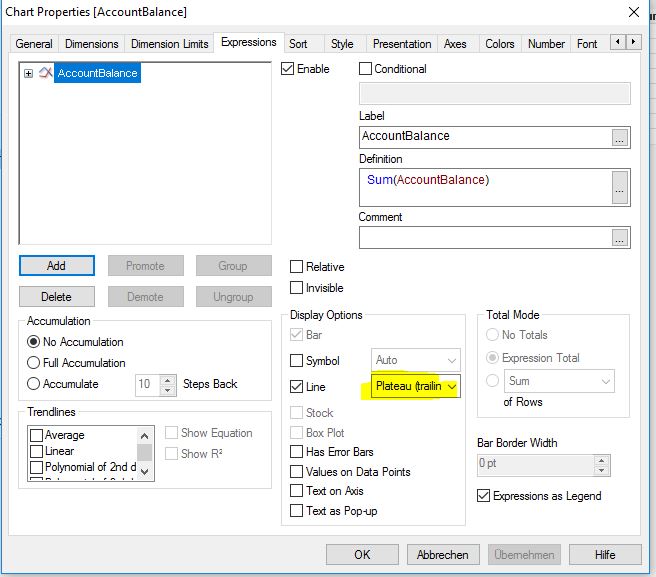
you could change the line style to "Plateau (trailing)" to get a stepped instead of an interpolated line:
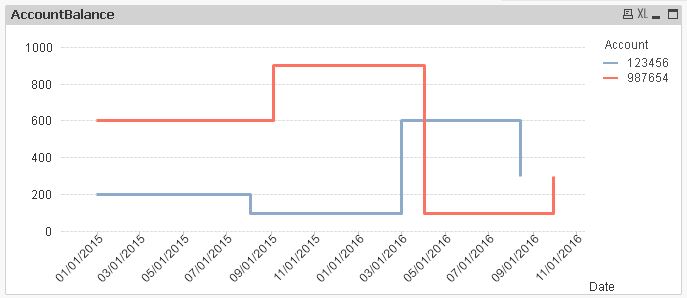
Sum(AccountBalance) wouldn't make much sense as this field already is accumulated.
Sum([Accounted Net]) on the other hand would show the changes within a period though not the absolute AccountBalance value.
So I guess one possibility might be to present average values for a given period and use error bars to show the Min/Max range.
hope this helps
regards
Marco
- Mark as New
- Bookmark
- Subscribe
- Mute
- Subscribe to RSS Feed
- Permalink
- Report Inappropriate Content
You could mess around creating a whole bunch of variables to drive the charts - or you could simply aggregate in a balance field in the script. To be honest, after messing around with this for a couple of hours just to see how it could be done in the front end, aggregating in the script is much simpler, from a set up, and ongoing usage point of view.
- Mark as New
- Bookmark
- Subscribe
- Mute
- Subscribe to RSS Feed
- Permalink
- Report Inappropriate Content
Thanks for that! I didn't know the "Plateau"-styles.
Looking at your initial suggestion and what rblakemore said below I concluded that aggregation in the script is probably the right way to go.
But of course the sample data in my question was simplified and I ran into some other difficulties applying your solution. Hope you might have some ideas here as well:
1) I have more than one movement per account and day and thus, several balances for one date. In my report I would like to display only the last balance per day. Not sure whether to implement this in the script as well or in the chart.
2) I want the user to see box plot grapghs when selecting a time frame of a certain length. Thus I'd need the average day end balance in a month and the highest and lowest day and balance within the month and of course the month's start and end balance. I am again not sure whether I can create all those values in the script or whether I should so it via expressions in the chart.
Would appreciate all kind of suggestions. Thanks!
PS: I attached a CSV with some random data I currently experimenting with.