Unlock a world of possibilities! Login now and discover the exclusive benefits awaiting you.
- Qlik Community
- :
- All Forums
- :
- QlikView App Dev
- :
- Re: Accumulation sum in pivot table
- Subscribe to RSS Feed
- Mark Topic as New
- Mark Topic as Read
- Float this Topic for Current User
- Bookmark
- Subscribe
- Mute
- Printer Friendly Page
- Mark as New
- Bookmark
- Subscribe
- Mute
- Subscribe to RSS Feed
- Permalink
- Report Inappropriate Content
Accumulation sum in pivot table
Hello, I have a following data
LOAD * INLINE [
Year, Country, Sales
2010, USA, 6013
2011, USA, 5295
2012, USA, 5551
2013, USA, 6932
2010, UK, 4512
2011, UK, 3976
2012, UK, 4691
2013, UK, 5276
2010, Japan, 2765
2011, Japan, 2567
2012, Japan, 3111
2013, Japan, 3234
2010, Germany, 4374
2011, Germany, 5673
2012, Germany, 4322
2013, Germany, 7654
2010, France, 4965
2011, France, 5097
2012, France, 5419
2013, France, 5732
2010, Australia, 3966
2011, Australia, 4087
2012, Australia, 2376
2013, Australia, 3784
];
If I create a new pivot with Year and Country dimensions
I can easily calculate:
Sales by Country =Sum(Sales)
Total in country dimension =RangeSum(Above(Sum(Sales),0,RowNo()))
And overall Total =RangeSum(Above(TOTAL Sum(Sales), 0, RowNo(TOTAL)))
How can I calculate an overall total by countries? I want full accumulation sum only by countries through the years. This can be easily achieved by swapping dimensions, but this method does not suit me.
- Tags:
- accumulation
- rangesum
- « Previous Replies
-
- 1
- 2
- Next Replies »
Accepted Solutions
- Mark as New
- Bookmark
- Subscribe
- Mute
- Subscribe to RSS Feed
- Permalink
- Report Inappropriate Content
Hi, before I copied the wrong expression, I wanted to to say this:
If(IsNull(Above(TOTAL Acc, Count(DISTINCT TOTAL Country))), 0 , Above(TOTAL Acc, Count(DISTINCT TOTAL Country)))+Sum(Sales)
Acc is the name of the expression
- Mark as New
- Bookmark
- Subscribe
- Mute
- Subscribe to RSS Feed
- Permalink
- Report Inappropriate Content
Did you try straight chart for this it will give good performance.
Regards
Anand
- Mark as New
- Bookmark
- Subscribe
- Mute
- Subscribe to RSS Feed
- Permalink
- Report Inappropriate Content
Hi Oleg,
not sure, if it fullfill your request...
RangeSum(Above(aggr(Sum(Sales), Country), 0, RowNo(TOTAL)))
BR
M
- Mark as New
- Bookmark
- Subscribe
- Mute
- Subscribe to RSS Feed
- Permalink
- Report Inappropriate Content
I want to get Line Chart like this
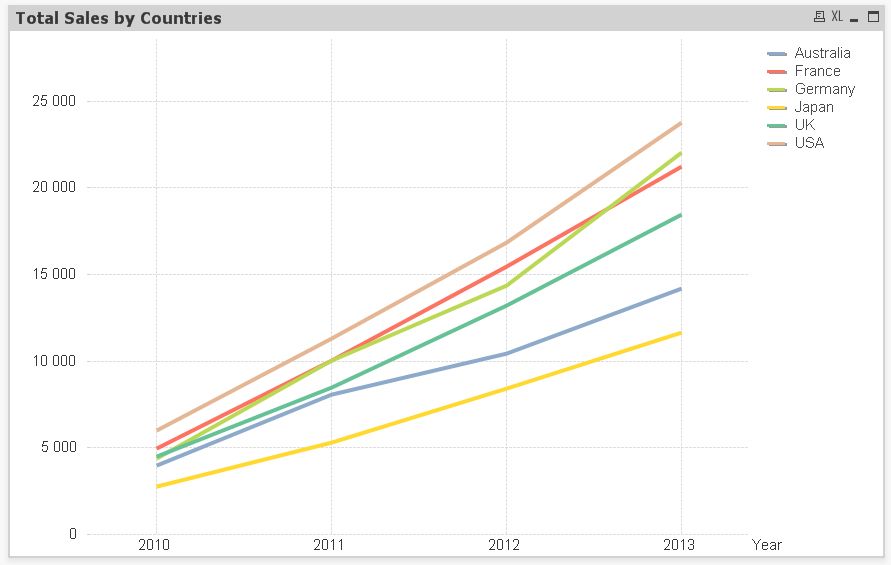
But only way i see is to make an espression for each country.
=RangeSum(Above(Sum({<Country={'Australia'}>}Sales),0,RowNo()))
- Mark as New
- Bookmark
- Subscribe
- Mute
- Subscribe to RSS Feed
- Permalink
- Report Inappropriate Content
In this case, you can use Year, Country as dimensions and sum(sales) as expression, but mark Full Accumulation.
- Mark as New
- Bookmark
- Subscribe
- Mute
- Subscribe to RSS Feed
- Permalink
- Report Inappropriate Content
Yes, it works.
But can i do it without built-in Accumulation?
- Mark as New
- Bookmark
- Subscribe
- Mute
- Subscribe to RSS Feed
- Permalink
- Report Inappropriate Content
Hi, before I copied the wrong expression, I wanted to to say this:
If(IsNull(Above(TOTAL Acc, Count(DISTINCT TOTAL Country))), 0 , Above(TOTAL Acc, Count(DISTINCT TOTAL Country)))+Sum(Sales)
Acc is the name of the expression
- Mark as New
- Bookmark
- Subscribe
- Mute
- Subscribe to RSS Feed
- Permalink
- Report Inappropriate Content
It works! Now I will try to understand how it works ))). Do you think it is easiest way?
- Mark as New
- Bookmark
- Subscribe
- Mute
- Subscribe to RSS Feed
- Permalink
- Report Inappropriate Content
Probably there is a better and easier way, but I don't get how to do it right now.
Martin's solution is the easiest way if you can fit that in your requirements.
The expression I suggest will only work if there are the same number countries each year. It takes the last accumulated value 6 rows above (6=Number of countries) and sum the sales of the current row.
The first IsNull is to check if this is the first value for each country, and sum '0' instead of NULL (NULL+Value = NULL, 0+Value=Value)
- Mark as New
- Bookmark
- Subscribe
- Mute
- Subscribe to RSS Feed
- Permalink
- Report Inappropriate Content
Hi,
You can use the Alt() function like :
Alt(Above(TOTAL Acc, Count(DISTINCT TOTAL Country)), 0) + Sum(Sales)
Alt : The alt function returns the first of the parameters that has a valid number representation.
Best
- « Previous Replies
-
- 1
- 2
- Next Replies »