Unlock a world of possibilities! Login now and discover the exclusive benefits awaiting you.
- Qlik Community
- :
- All Forums
- :
- QlikView App Dev
- :
- Re: Adding rank to a chart that continues after yo...
- Subscribe to RSS Feed
- Mark Topic as New
- Mark Topic as Read
- Float this Topic for Current User
- Bookmark
- Subscribe
- Mute
- Printer Friendly Page
- Mark as New
- Bookmark
- Subscribe
- Mute
- Subscribe to RSS Feed
- Permalink
- Report Inappropriate Content
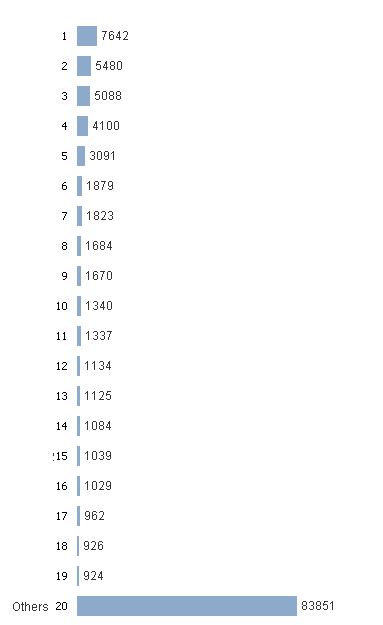
Adding rank to a chart that continues after you click others with dimension limit
I have a combo chart that has a dimension of supplier, an expression shown as a bar chart for a count of orders.
There is a dimension limit of the 20 largest values and Show others is ticked.
I added a second expression =rowno(TOTAL) to give me a row number and this is only shown as text on axis.
This works great for the first 19 and this is what i have currently
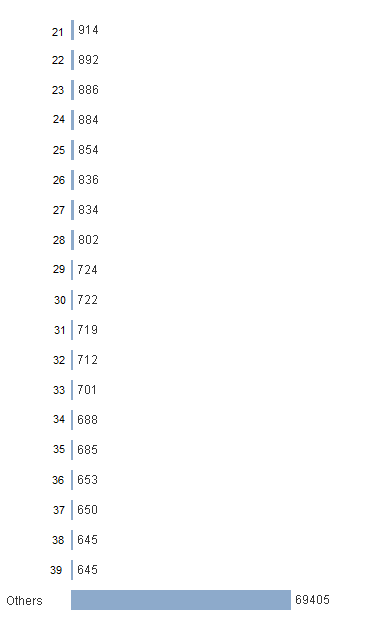
However when i click others to get the next 20 it numbers them 1 to 20 again..
I want to achieve 2 things.
1. I want the numbers to continues on when others is clicked and show them as 20 to 39, then 40 to 59 etc.
2. I dont want the "Others" bar to have a number as it is technically not in order.
Expected output:
THEN WHEN OTHERS IS CLICKED..
- Mark as New
- Bookmark
- Subscribe
- Mute
- Subscribe to RSS Feed
- Permalink
- Report Inappropriate Content
May be use below instead of RowNo(TOTAL)
If(Count(Orders) > 0, Num(Rank(Count({<SupplierField>}Orders), 4, 4)))
If(Count(Orders) > 0, Num(Rank(Count({<SupplierField>}Orders), 4)))
- Mark as New
- Bookmark
- Subscribe
- Mute
- Subscribe to RSS Feed
- Permalink
- Report Inappropriate Content
Still the same except now there ranked 2 to 20 and others is ranked 1
AND when you click others the ranking is the same 2 - 20 for the next lot
- Mark as New
- Bookmark
- Subscribe
- Mute
- Subscribe to RSS Feed
- Permalink
- Report Inappropriate Content
To fix the order, I think you just need to add a negative sign:
If(Count(Orders) > 0, Num(Rank(-Count({<SupplierField>}Orders), 4)))
Do you have a sample to play around with?
- Mark as New
- Bookmark
- Subscribe
- Mute
- Subscribe to RSS Feed
- Permalink
- Report Inappropriate Content
Still the same issues. let me get a sample
- Mark as New
- Bookmark
- Subscribe
- Mute
- Subscribe to RSS Feed
- Permalink
- Report Inappropriate Content
Consider you have below data.
Load * Inline
[
Customer, Sales
A, 100
B, 120
C, 105
D, 50
E, 60
F, 150
G, 200
H, 125
I, 130
J, 90
K, 95
L, 30
M, 20
N, 25
O, 25
P, 100
Q, 120
R, 110
S, 150
];
Now you want to show TOP 4 customers and rest should be merged in Other. When you click on Other, it will show you 5 to 8 Ranked customer and rest need to be merged as other.
You can use as below
Create a Bar Chart
Calculated Dimension
=Aggr(IF(Rank(SUM(Sales),4)<=4,
NUM(Aggr(Rank(TOTAL SUM({<Customer=>}Sales),4),Customer)),
Dual('Other',1000))
,Customer)
Expression
Dual('Customer : ' & Customer & CHR(10) & ' Rank : ' & NUM(Aggr(Rank(TOTAL SUM({<Customer=>}Sales)),Customer)) & CHR(10) & 'Sales : ' & SUM(Sales), SUM(Sales))
Sort by Numeric Value Ascending Order.
Let me know if this is not working.
File enclosed for your reference.
NOTE : Instead of TOP 4, you can change to TOP 10 or whatever number you want. You have to change the bold RED numbers.