Unlock a world of possibilities! Login now and discover the exclusive benefits awaiting you.
- Qlik Community
- :
- All Forums
- :
- QlikView App Dev
- :
- Re: Aggr function not working
- Subscribe to RSS Feed
- Mark Topic as New
- Mark Topic as Read
- Float this Topic for Current User
- Bookmark
- Subscribe
- Mute
- Printer Friendly Page
- Mark as New
- Bookmark
- Subscribe
- Mute
- Subscribe to RSS Feed
- Permalink
- Report Inappropriate Content
Aggr function not working
Hi all,
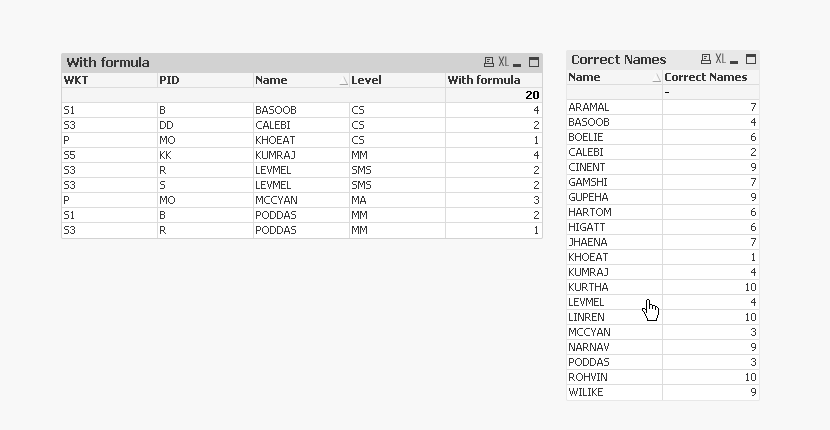
I am trying to get something simple to work but it just doesn't. Attached qvw file has a table with four dimensions. The goal is to figure out which persons have worked less than 10 hours on all projects combined. I thought the simple formula was:
=if(aggr(sum(Hours), Name) <= 10, sum(Hours)).
This expression gives me the correct names but not the correct amount of hours or projects. Example; the person called CINENT should show 9 hours in total of which 3 in PID R and 6 in PID S. However, R shows up but S is missing.
Can somebody help?
Many thanks in advance.
- « Previous Replies
-
- 1
- 2
- Next Replies »
- Mark as New
- Bookmark
- Subscribe
- Mute
- Subscribe to RSS Feed
- Permalink
- Report Inappropriate Content
Try this
=Sum({<Name = {"=Sum(Hours) <= 10"}>}Hours)
- Mark as New
- Bookmark
- Subscribe
- Mute
- Subscribe to RSS Feed
- Permalink
- Report Inappropriate Content
Hi Sunny,
Many thanks for the fast reply. The way you showed it works perfect in the example I provided. That said, I did simplify the example as I thought it would be easy to add two additional requirements to the set analysis. However, once more it doesn't work.
In my first example, there was only the year 2018 and the month Sep. However, in the real dataset, there are multiple years and moths and I need to be able to specify the year and month. I added it to the set analysis but it doesn't seem to work. Any thoughts?
Thanks again for your help! !
I would have liked to add another attachment to show you what I mean but it seems I don't have that option. Let me post another one in this thread
- Mark as New
- Bookmark
- Subscribe
- Mute
- Subscribe to RSS Feed
- Permalink
- Report Inappropriate Content
Hi Sunny,
I edited my original post and attached a new test.qvw to show you what I mean.
Thanks!
- Mark as New
- Bookmark
- Subscribe
- Mute
- Subscribe to RSS Feed
- Permalink
- Report Inappropriate Content
Did you try adding Year and Month to Sunny's expr like:
=Sum({<Name = {"=Sum(Hours) <= 10"}, Year = {'2018'}, Month={'Sep'}>}Hours)
- Mark as New
- Bookmark
- Subscribe
- Mute
- Subscribe to RSS Feed
- Permalink
- Report Inappropriate Content
Based on the new requirement what is the output you are hoping to get?
- Mark as New
- Bookmark
- Subscribe
- Mute
- Subscribe to RSS Feed
- Permalink
- Report Inappropriate Content
Hi Sunny,
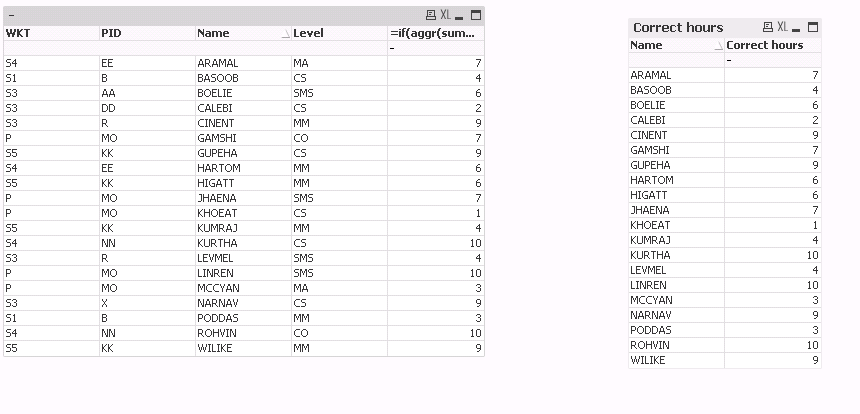
The output requirement is still the same. Allow me to recap, I have a table with 4 dimensions and number of hours. In that table, I only want to keep the rows (with 4 dimensions) where if you would add up the number of hours by Name, it is less or equal to 10 hours for the last month. So I want to show a table with 4 columns and hours of the people that have work equal or less than 10 hours in total (across all projects) the last month
So your formula works perfect until I add in the conditions that it should only be for the most recent month of the most recent year (which is done with a variable). The formula I have (but doesn't work) is the following:
=Sum({<Name = {"=Sum(Hours) <= 10"}, Year = {'$(vMaxYear)'}, Month={'vMaxMonth'}>} Hours)''
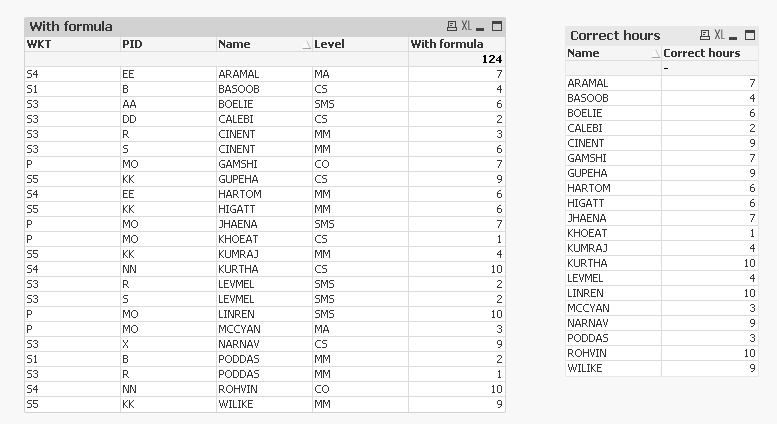
I added screenshots but I also edited my original post to update the attachment to reflect the month and year requirement with the correct data (I hardcoded month and year rather than using variables in the example though)
The right table are the names that should show on the left table. However, with the formula above, you see I am missing quiet a few.
Many thanks!
Thanks,
- Mark as New
- Bookmark
- Subscribe
- Mute
- Subscribe to RSS Feed
- Permalink
- Report Inappropriate Content
Hi Vishwarath,
I tried that too but didn't work. For some reason, only part of the names show up and not all.
Thanks anyways for your suggestion
- Mark as New
- Bookmark
- Subscribe
- Mute
- Subscribe to RSS Feed
- Permalink
- Report Inappropriate Content
Hi,
I've got the result you wanted simply by adding aggr to both parametres of your correct IF expression:
=if(aggr(sum({$<Year={'2018'}, Month={'Sep'}>} Hours),Name) <= 10, aggr(sum({$<Year={'2018'}, Month={'Sep'}>} Hours),Name))
- Mark as New
- Bookmark
- Subscribe
- Mute
- Subscribe to RSS Feed
- Permalink
- Report Inappropriate Content
Then try this
=Sum({<Name = {"=Sum({<Year={'2018'}, Month={'Sep'}>}Hours) <= 10"}, Year={'2018'}, Month={'Sep'}>} Hours)
Essentially your check also needed the same set analysis as your main expression
- « Previous Replies
-
- 1
- 2
- Next Replies »