Unlock a world of possibilities! Login now and discover the exclusive benefits awaiting you.
- Qlik Community
- :
- All Forums
- :
- QlikView App Dev
- :
- Re: Aggregating Previous Rows in a Straight Table
- Subscribe to RSS Feed
- Mark Topic as New
- Mark Topic as Read
- Float this Topic for Current User
- Bookmark
- Subscribe
- Mute
- Printer Friendly Page
- Mark as New
- Bookmark
- Subscribe
- Mute
- Subscribe to RSS Feed
- Permalink
- Report Inappropriate Content
Aggregating Previous Rows in a Straight Table
Hi,
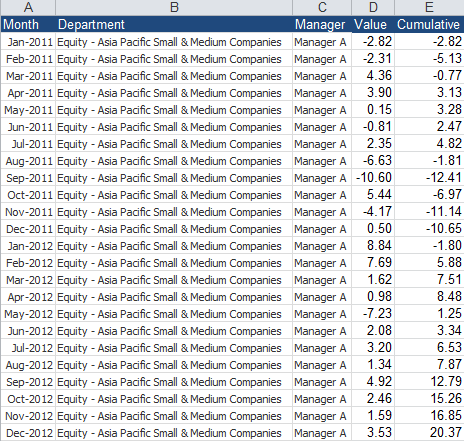
I have been struggling to get this to work and would be really grateful if someone could give me some pointers. Basically I have a table that has 3 dimensions - Manager, Department and Date.
What I would like to be able to do is sum up the sales for the manager in a particular department for the current month and all previous months in the selection. I have seen solutions using an As Of Date table but I don't think this will work for my current scenario as the number of months selected can be varied by the end user.
My initial thoughts were to use set analysis but obviously you can't look at the dimensions value in a particular row in the set analysis.
An example table of what I am trying to achieve is attached for a single manager, the chart could have multiple managers and multiple departments however.
- Mark as New
- Bookmark
- Subscribe
- Mute
- Subscribe to RSS Feed
- Permalink
- Report Inappropriate Content
You could create an AsOf table for all the period lengths the user can choose from. Or you can use the rangesum function. Something like
sum(aggr(rangesum(above(total sum({<Month=>}Amount),0,$(vNoOfMonths))),Month))
where vNoOfMonths is a variable for the number of months which the user gets to choose.
talk is cheap, supply exceeds demand
- Mark as New
- Bookmark
- Subscribe
- Mute
- Subscribe to RSS Feed
- Permalink
- Report Inappropriate Content
Thanks for your suggestions.
Using a n As Of Table how would I know which period in this table to use based on the row number in the straight table.
I spent a lot of time trying to use the rangesum approach and had it working perfectly for one manager. The problem came when I wanted to represent multiple managers on a chart because the dimension ordering changed from Manager > Department > Month to Month > Manager > Department which meant that the range sum was looking at the wrong rows for its aggregation?