Unlock a world of possibilities! Login now and discover the exclusive benefits awaiting you.
- Qlik Community
- :
- All Forums
- :
- QlikView App Dev
- :
- Aggregation on Dimension
- Subscribe to RSS Feed
- Mark Topic as New
- Mark Topic as Read
- Float this Topic for Current User
- Bookmark
- Subscribe
- Mute
- Printer Friendly Page
- Mark as New
- Bookmark
- Subscribe
- Mute
- Subscribe to RSS Feed
- Permalink
- Report Inappropriate Content
Aggregation on Dimension
I have a dataset like Excel attached (please refer to Help with Set Analysis and aggregation as requirement)
stalwar1 brightly helped me to find a way of creating my expression to find
(aggregated on [ID Som]) how many segments have a [ID Som] that have a segment = Silence of Duration between 22 and 66 (example) and also have segments = MUSIC of duration between 5 and 20.
In this sample I should have:
- 787 - 4
- 882 - 0 (It has SILENCE but hasn´t MUSIC)
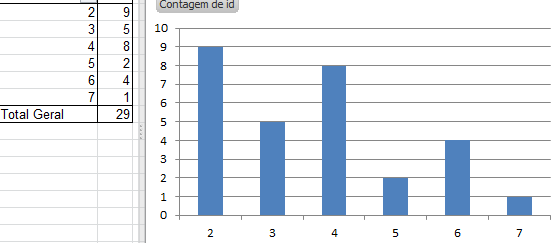
Now I have to create a graph like this
how many [ID Som] have 2 segments, ow many [ID Som] have 3 segments and so on.
Any idea how to solve this?
Accepted Solutions
- Mark as New
- Bookmark
- Subscribe
- Mute
- Subscribe to RSS Feed
- Permalink
- Report Inappropriate Content
- Mark as New
- Bookmark
- Subscribe
- Mute
- Subscribe to RSS Feed
- Permalink
- Report Inappropriate Content
Check if the attached meets your requirement?
- Mark as New
- Bookmark
- Subscribe
- Mute
- Subscribe to RSS Feed
- Permalink
- Report Inappropriate Content
Updated sample
- Mark as New
- Bookmark
- Subscribe
- Mute
- Subscribe to RSS Feed
- Permalink
- Report Inappropriate Content
stalwar1, you really deserve to be at Qlik Mount Olympus 
- Mark as New
- Bookmark
- Subscribe
- Mute
- Subscribe to RSS Feed
- Permalink
- Report Inappropriate Content
Where is that taking place, I am in 
- Mark as New
- Bookmark
- Subscribe
- Mute
- Subscribe to RSS Feed
- Permalink
- Report Inappropriate Content
Could you please also post the expression in this thread, so I can also learn.
No Qlik View and can not open the attached file.
Thanks!
- Mark as New
- Bookmark
- Subscribe
- Mute
- Subscribe to RSS Feed
- Permalink
- Report Inappropriate Content
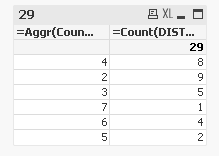
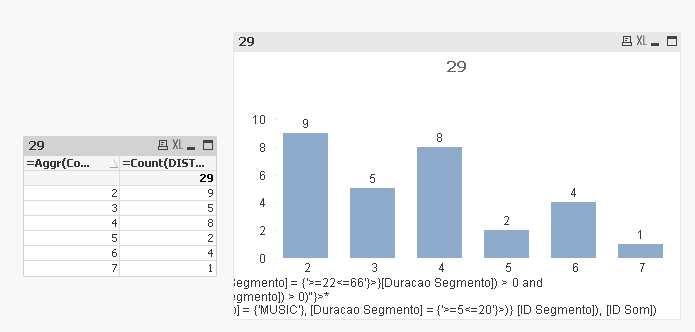
My final expression use some variables but these expression is correct
=Aggr(Count(DISTINCT {<[ID Som] = {"=(Count({<[Tipo Segmento] = {'SILENCE'}, [Duracao Segmento] = {'>=22<=66'}>}[Duracao Segmento]) > 0 and
Count({<[Tipo Segmento] = {'MUSIC'}, [Duracao Segmento] = {'>=5<=20'}>}[Duracao Segmento]) > 0)"}>*
(<[Tipo Segmento] = {'SILENCE'}, [Duracao Segmento] = {'>=22<=66'}>+<[Tipo Segmento] = {'MUSIC'}, [Duracao Segmento] = {'>=5<=20'}>)} [ID Segmento]), [ID Som])