Unlock a world of possibilities! Login now and discover the exclusive benefits awaiting you.
- Qlik Community
- :
- All Forums
- :
- QlikView App Dev
- :
- Average the top 95percentile only
- Subscribe to RSS Feed
- Mark Topic as New
- Mark Topic as Read
- Float this Topic for Current User
- Bookmark
- Subscribe
- Mute
- Printer Friendly Page
- Mark as New
- Bookmark
- Subscribe
- Mute
- Subscribe to RSS Feed
- Permalink
- Report Inappropriate Content
Average the top 95percentile only
Hello
If any one can help me with the below screen shot.
1. Need to find the 95th percentile of the orders
2.need to avg or sum those orders in red
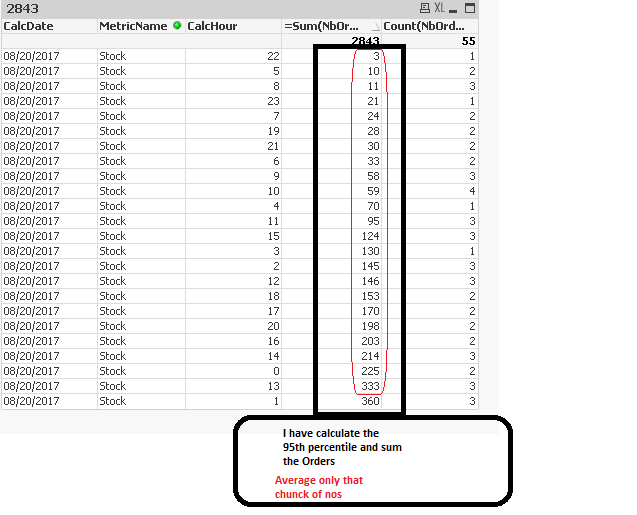
in the above table I need to calculate the 95th percentile of the orders sorted and then calculate the average or Sum of those number which is in red.
Please help
Regards
A
- « Previous Replies
-
- 1
- 2
- Next Replies »
Accepted Solutions
- Mark as New
- Bookmark
- Subscribe
- Mute
- Subscribe to RSS Feed
- Permalink
- Report Inappropriate Content
Maybe something like
Avg(Aggr( If(Rank(-Sum(NbOrders))< 0.95*Count(DISTINCT TOTAL CalcHour), Sum(NbOrders)), CalcDate, CalcHour))
| CalcDate | MetricName | CalcHour | Sum(NbOrders) | Num(Rank(-Sum(NbOrders),0,4)) | Avg(Aggr( If(Rank(-Sum(NbOrders))< 0.95*Count(DISTINCT TOTAL CalcHour), Sum(NbOrders)), CalcDate, CalcHour)) |
|---|---|---|---|---|---|
| 1554 | 52 | ||||
| 08/20/2017 | Stock | 22 | 3 | 1 | 3 |
| 08/20/2017 | Stock | 8 | 6 | 2 | 6 |
| 08/20/2017 | Stock | 5 | 8 | 3 | 8 |
| 08/20/2017 | Stock | 19 | 8 | 3 | 8 |
| 08/20/2017 | Stock | 7 | 14 | 5 | 14 |
| 08/20/2017 | Stock | 23 | 21 | 6 | 21 |
| 08/20/2017 | Stock | 9 | 23 | 7 | 23 |
| 08/20/2017 | Stock | 21 | 27 | 8 | 27 |
| 08/20/2017 | Stock | 10 | 28 | 9 | 28 |
| 08/20/2017 | Stock | 6 | 32 | 10 | 32 |
| 08/20/2017 | Stock | 11 | 36 | 11 | 36 |
| 08/20/2017 | Stock | 12 | 37 | 12 | 37 |
| 08/20/2017 | Stock | 18 | 46 | 13 | 46 |
| 08/20/2017 | Stock | 15 | 53 | 14 | 53 |
| 08/20/2017 | Stock | 4 | 70 | 15 | 70 |
| 08/20/2017 | Stock | 17 | 77 | 16 | 77 |
| 08/20/2017 | Stock | 13 | 83 | 17 | 83 |
| 08/20/2017 | Stock | 20 | 86 | 18 | 86 |
| 08/20/2017 | Stock | 2 | 100 | 19 | 100 |
| 08/20/2017 | Stock | 16 | 113 | 20 | 113 |
| 08/20/2017 | Stock | 3 | 130 | 21 | 130 |
| 08/20/2017 | Stock | 14 | 143 | 22 | 143 |
| 08/20/2017 | Stock | 1 | 186 | 23 | |
| 08/20/2017 | Stock | 0 | 224 | 24 |
- Mark as New
- Bookmark
- Subscribe
- Mute
- Subscribe to RSS Feed
- Permalink
- Report Inappropriate Content
Provide sample work file?
- Mark as New
- Bookmark
- Subscribe
- Mute
- Subscribe to RSS Feed
- Permalink
- Report Inappropriate Content
try
=avg(total aggr(Fractile(total Value,0.95),CalcDate,MetricName)
- Mark as New
- Bookmark
- Subscribe
- Mute
- Subscribe to RSS Feed
- Permalink
- Report Inappropriate Content
Hi Arjun
You can use Fractile() function calculate 95 percentile
fractile(TOTAL aggr(Sum(Field name ),Field_Name_1), 0.95)
Thanks
Ankur
- Mark as New
- Bookmark
- Subscribe
- Mute
- Subscribe to RSS Feed
- Permalink
- Report Inappropriate Content
Anil I have attached the File to this chain
- Mark as New
- Bookmark
- Subscribe
- Mute
- Subscribe to RSS Feed
- Permalink
- Report Inappropriate Content
Hello kushal
Thanks for replying
I tried with your formula but I am unable to get it working
Attached the file
- Mark as New
- Bookmark
- Subscribe
- Mute
- Subscribe to RSS Feed
- Permalink
- Report Inappropriate Content
Attached the file,
1.I have to sum the orders
2.I have sort the orders by rank by ascending order
3.then find the 95th percentile and average the those top 95 percentile
thanks for reply with the formula, I tried with that but I am unable to get it work
- Mark as New
- Bookmark
- Subscribe
- Mute
- Subscribe to RSS Feed
- Permalink
- Report Inappropriate Content
Hello Ankur
I tried with your formula too, still I am not able to get it work

- Mark as New
- Bookmark
- Subscribe
- Mute
- Subscribe to RSS Feed
- Permalink
- Report Inappropriate Content
Maybe something like
Avg(Aggr( If(Rank(-Sum(NbOrders))< 0.95*Count(DISTINCT TOTAL CalcHour), Sum(NbOrders)), CalcDate, CalcHour))
| CalcDate | MetricName | CalcHour | Sum(NbOrders) | Num(Rank(-Sum(NbOrders),0,4)) | Avg(Aggr( If(Rank(-Sum(NbOrders))< 0.95*Count(DISTINCT TOTAL CalcHour), Sum(NbOrders)), CalcDate, CalcHour)) |
|---|---|---|---|---|---|
| 1554 | 52 | ||||
| 08/20/2017 | Stock | 22 | 3 | 1 | 3 |
| 08/20/2017 | Stock | 8 | 6 | 2 | 6 |
| 08/20/2017 | Stock | 5 | 8 | 3 | 8 |
| 08/20/2017 | Stock | 19 | 8 | 3 | 8 |
| 08/20/2017 | Stock | 7 | 14 | 5 | 14 |
| 08/20/2017 | Stock | 23 | 21 | 6 | 21 |
| 08/20/2017 | Stock | 9 | 23 | 7 | 23 |
| 08/20/2017 | Stock | 21 | 27 | 8 | 27 |
| 08/20/2017 | Stock | 10 | 28 | 9 | 28 |
| 08/20/2017 | Stock | 6 | 32 | 10 | 32 |
| 08/20/2017 | Stock | 11 | 36 | 11 | 36 |
| 08/20/2017 | Stock | 12 | 37 | 12 | 37 |
| 08/20/2017 | Stock | 18 | 46 | 13 | 46 |
| 08/20/2017 | Stock | 15 | 53 | 14 | 53 |
| 08/20/2017 | Stock | 4 | 70 | 15 | 70 |
| 08/20/2017 | Stock | 17 | 77 | 16 | 77 |
| 08/20/2017 | Stock | 13 | 83 | 17 | 83 |
| 08/20/2017 | Stock | 20 | 86 | 18 | 86 |
| 08/20/2017 | Stock | 2 | 100 | 19 | 100 |
| 08/20/2017 | Stock | 16 | 113 | 20 | 113 |
| 08/20/2017 | Stock | 3 | 130 | 21 | 130 |
| 08/20/2017 | Stock | 14 | 143 | 22 | 143 |
| 08/20/2017 | Stock | 1 | 186 | 23 | |
| 08/20/2017 | Stock | 0 | 224 | 24 |
- Mark as New
- Bookmark
- Subscribe
- Mute
- Subscribe to RSS Feed
- Permalink
- Report Inappropriate Content
Hello Stefan,
This works for me to find the 95th percentile and average of that as you have done, but it changes when i remove the selections.
Ideally I want the table to be like this

with or without selections I should have the same result as above
- « Previous Replies
-
- 1
- 2
- Next Replies »