Unlock a world of possibilities! Login now and discover the exclusive benefits awaiting you.
- Qlik Community
- :
- All Forums
- :
- QlikView App Dev
- :
- Re: Bar Chart Legend Issue: Two Dimensions, mislea...
- Subscribe to RSS Feed
- Mark Topic as New
- Mark Topic as Read
- Float this Topic for Current User
- Bookmark
- Subscribe
- Mute
- Printer Friendly Page
- Mark as New
- Bookmark
- Subscribe
- Mute
- Subscribe to RSS Feed
- Permalink
- Report Inappropriate Content
Bar Chart Legend Issue: Two Dimensions, misleading legend
I have a bar chart that counts issues by year and business line.
It works fine for the most part but has a display issue when showing more than one year.
See images below:
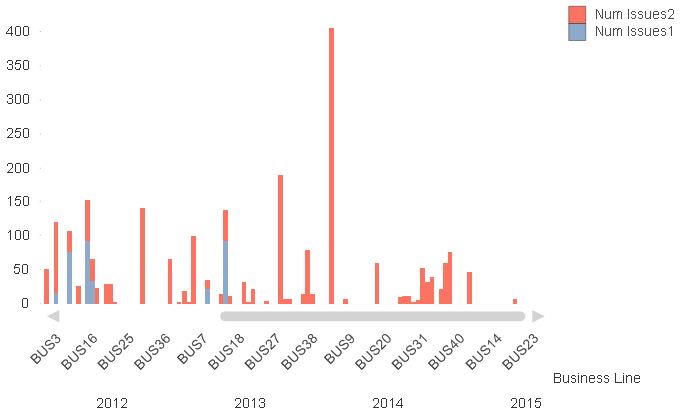
Note that BUS3, BUS16 and BUS25 are shown above year 2012.
However when you click on 2012, not all of those business lines actually have data associated with them:
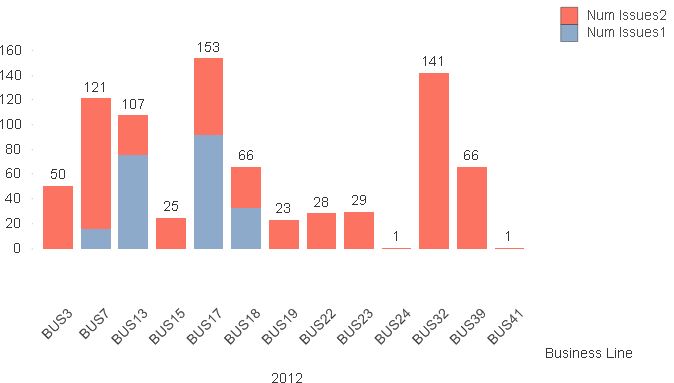
While BUS3 does have associated data, there is none for BUS16 and BUS25.
I would like the top chart to show only Business Lines that have values for a given year, just as it does when you select a year (2nd image) or if that's not possible at least fewer REAL business line names than in year view, but that have real values associated with them.
Thanks in advance for your help.
- Mark as New
- Bookmark
- Subscribe
- Mute
- Subscribe to RSS Feed
- Permalink
- Report Inappropriate Content
Hi.
The object chart bar with two dimensions allow, in Presentation tab, Chart Scrolling, checkbox Enale X-Axis Scrollbar, just manipulate the 1st dimension. So, Bus2 is disabled (the chart does not scroll).
I think that with two dimensions and more that one expression, is better show the result in Pivot Table. See if the example attached help. Therefore, adjust colors, style, size font, null simbol, missing symbol, etc.
Probably, someone by here does have other idea.
Hope this helps!
- Mark as New
- Bookmark
- Subscribe
- Mute
- Subscribe to RSS Feed
- Permalink
- Report Inappropriate Content
Ok, so that helps me understand why the 2nd dimension looks weird (sort of) but I still need a way to shut off misleading legend. What I implemented in the meantime was a white text box that conditionally blocks the 2nd dimension legend when more than one year is selected or possible to select.
- Mark as New
- Bookmark
- Subscribe
- Mute
- Subscribe to RSS Feed
- Permalink
- Report Inappropriate Content
Go to Properties of the Chart
Select the presentation Tab
In the Chart Scrolling Block
Select Enable X-Axis Scrollbar
and change
When Number of Items Exceed to 1
Click Apply
Hope this Helps
- Mark as New
- Bookmark
- Subscribe
- Mute
- Subscribe to RSS Feed
- Permalink
- Report Inappropriate Content
Tony Schullo,
Sorry, the version of the upload was not like wanted. I made a new one with a different name. There is one tab Option 2 where appear pivot table.
Doubt on 2nd dimension is ther bar chart or pivot table? Give details, please.
- Mark as New
- Bookmark
- Subscribe
- Mute
- Subscribe to RSS Feed
- Permalink
- Report Inappropriate Content
No, that didn;t help since the BUS* legend below does not change to match years. But thank you for responding.