Unlock a world of possibilities! Login now and discover the exclusive benefits awaiting you.
- Qlik Community
- :
- All Forums
- :
- QlikView App Dev
- :
- Bar Chart
- Subscribe to RSS Feed
- Mark Topic as New
- Mark Topic as Read
- Float this Topic for Current User
- Bookmark
- Subscribe
- Mute
- Printer Friendly Page
- Mark as New
- Bookmark
- Subscribe
- Mute
- Subscribe to RSS Feed
- Permalink
- Report Inappropriate Content
Bar Chart
Hi All,
I am having a bar chart and there i am facing issue with the values.
The value what i am getting in text box is correct, but the value what i am getting in bar chart is wrong.
Can you please tell me where i am making wrong. For reference please find the attached app.
Thanks,
Bharat
- « Previous Replies
-
- 1
- 2
- Next Replies »
Accepted Solutions
- Mark as New
- Bookmark
- Subscribe
- Mute
- Subscribe to RSS Feed
- Permalink
- Report Inappropriate Content
- Mark as New
- Bookmark
- Subscribe
- Mute
- Subscribe to RSS Feed
- Permalink
- Report Inappropriate Content
What exactly are you trying to do here? Would you be able to elaborate a little?
- Mark as New
- Bookmark
- Subscribe
- Mute
- Subscribe to RSS Feed
- Permalink
- Report Inappropriate Content
Hi Sunny,
I have to calculate sum(IB) for feb for example if i select jan IB value is sum(IB) and if i select feb the sum(IB) value is (Jan+Feb) and if i select march the sum(IB) is Jan + Feb + Mar. And this value i need to divide by month. If i select mar.. the output should be jan+Feb+Mar/3, if i select Feb month the output is Jan+Feb/2..
These one i need to achieve in bar chart.
Please let me know if you need anything more.
Thanks,
Bharat
- Mark as New
- Bookmark
- Subscribe
- Mute
- Subscribe to RSS Feed
- Permalink
- Report Inappropriate Content
Hi Sunny ,
Please let me know if you need any more explanation or if i am not clear..
Thanks,
Bharat
- Mark as New
- Bookmark
- Subscribe
- Mute
- Subscribe to RSS Feed
- Permalink
- Report Inappropriate Content
Try this
Aggr(RangeAvg(Above(Sum({<MonthYear>}InstallBase), 0, RowNo())), Year, MonthName)
Where MonthName and Year are created like this
Fact_Cube_Data1:
LOAD MonthYear,
InstallBase,
[Strategic consumption]
FROM
(qvd);
BridgeTable:
LOAD DISTINCT MonthYear,
Year(MonthYear) as Year,
MonthName(MonthYear) as MonthName
Resident Fact_Cube_Data1
Order By MonthYear;
- Mark as New
- Bookmark
- Subscribe
- Mute
- Subscribe to RSS Feed
- Permalink
- Report Inappropriate Content
Hi Sunny,
Sorry if i explained wrong , Please find below with better understanding:
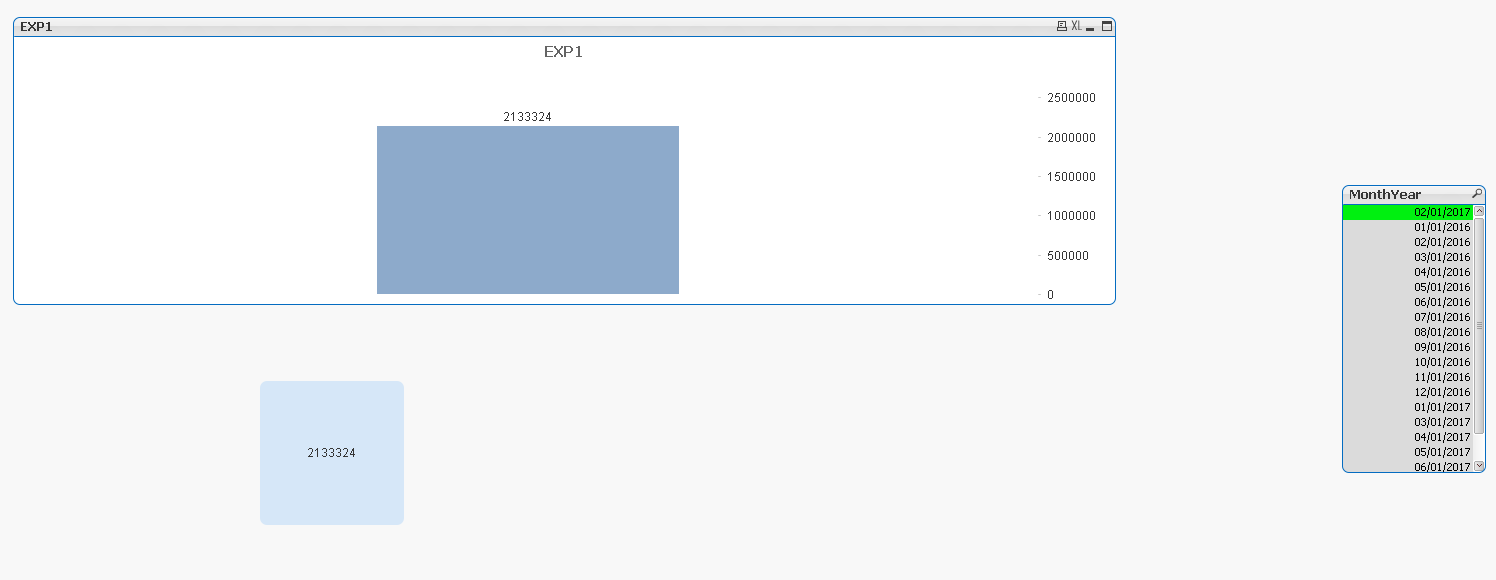
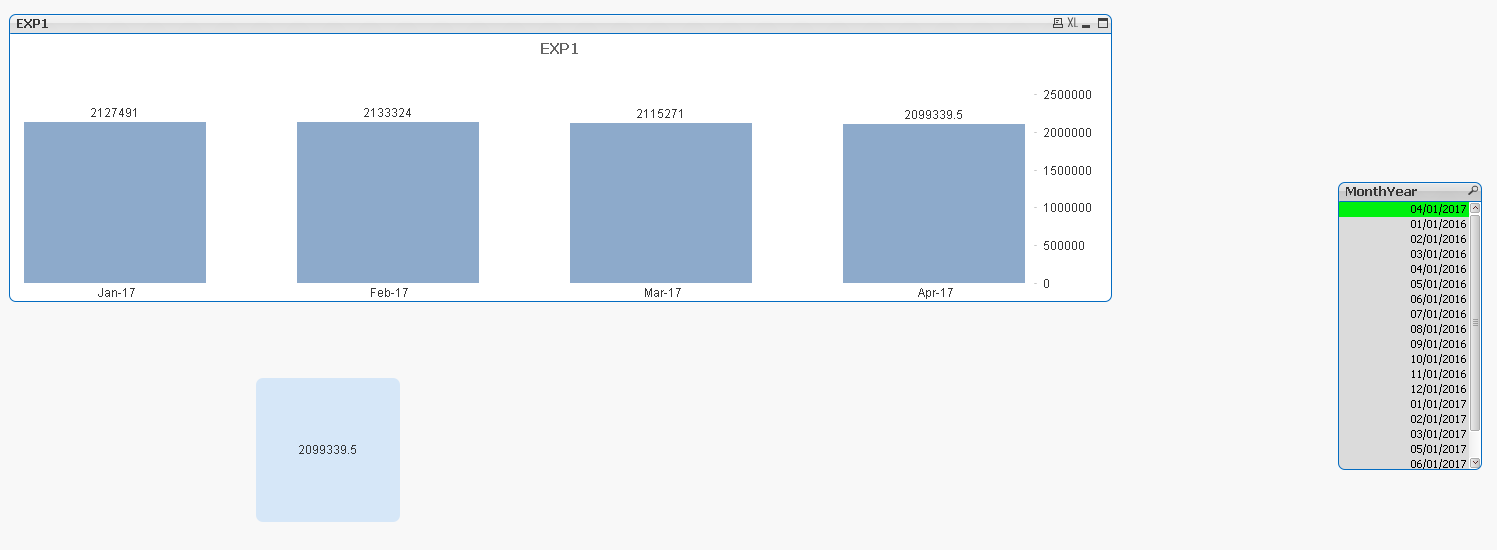
Firstly in bar graph based on the month selection the number of bars should appear. If i select March i need to see 3 bars and if i select april i need to see 4 bars.. I have selected March and i can see 3 bars.
Now in expression i have given full accumulation and the values are correct till here. Now only the problem is i am unable to divide month wise.
The expression what i have given in a text box there the value is coming perfectly. The same expression when i am trying to put in bar chart the value is coming differently.
If we can get the same value in the bar chart which is as in same as text box means it resolves the issue.
Please find the attached app and please let me know if you require anything more.
Thanks,
Bharat
- Mark as New
- Bookmark
- Subscribe
- Mute
- Subscribe to RSS Feed
- Permalink
- Report Inappropriate Content
This?
- Mark as New
- Bookmark
- Subscribe
- Mute
- Subscribe to RSS Feed
- Permalink
- Report Inappropriate Content
Thanks Genius, Thank u so much
This is what i needed. But i have one query is it possible to do without bridge table because the i have to change many things in my data and the data is huge.
Please let me know if we can do that way.
Thanks,
Bharat
- Mark as New
- Bookmark
- Subscribe
- Mute
- Subscribe to RSS Feed
- Permalink
- Report Inappropriate Content
Are you using QV12? If you are, then yes 
- Mark as New
- Bookmark
- Subscribe
- Mute
- Subscribe to RSS Feed
- Permalink
- Report Inappropriate Content
No QV 11... But is there anything wrong with my expression since the value is correct in text box and in chart it is wrong.
Can u pls tell me where i am doing wrong...
Thanks,
Bharat
- « Previous Replies
-
- 1
- 2
- Next Replies »