Unlock a world of possibilities! Login now and discover the exclusive benefits awaiting you.
- Qlik Community
- :
- All Forums
- :
- QlikView App Dev
- :
- Re: Bar char Properties - Total in second axis
- Subscribe to RSS Feed
- Mark Topic as New
- Mark Topic as Read
- Float this Topic for Current User
- Bookmark
- Subscribe
- Mute
- Printer Friendly Page
- Mark as New
- Bookmark
- Subscribe
- Mute
- Subscribe to RSS Feed
- Permalink
- Report Inappropriate Content
Bar char Properties - Total in second axis
Hi community,
I did this post in New to Qlikview but probably i wasnt searching for help in the right place.
So i'm facing a issue that i can't solve or find a turn around solution.
I have this bar chart:
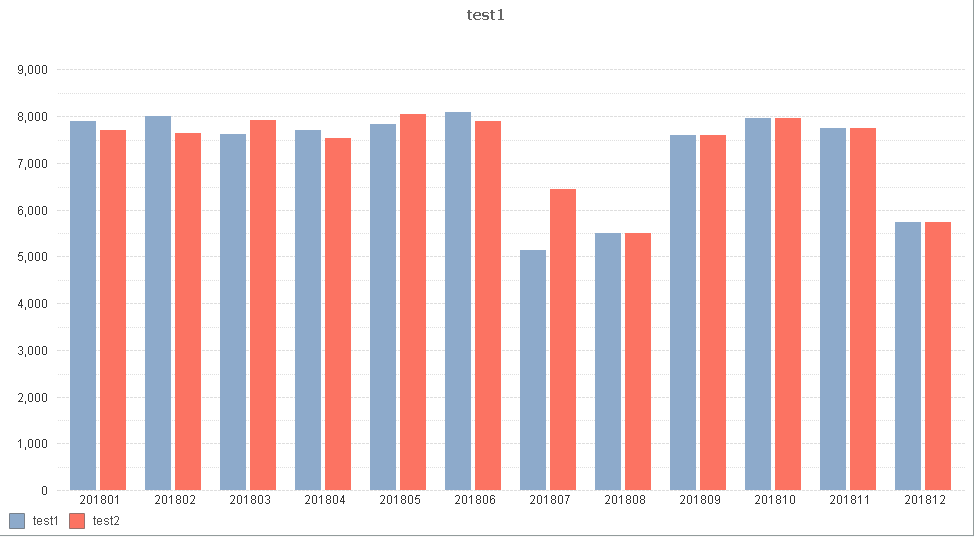
And i want show a total column.
I know i can go to Properties ---> Dimensions limits-----> in 'Options' block and mark Show Total it gives me the expected result. The trick is, i want to display the total in right y axe. Anyone has any idea how to go turn around this?
With the above solution i get this:
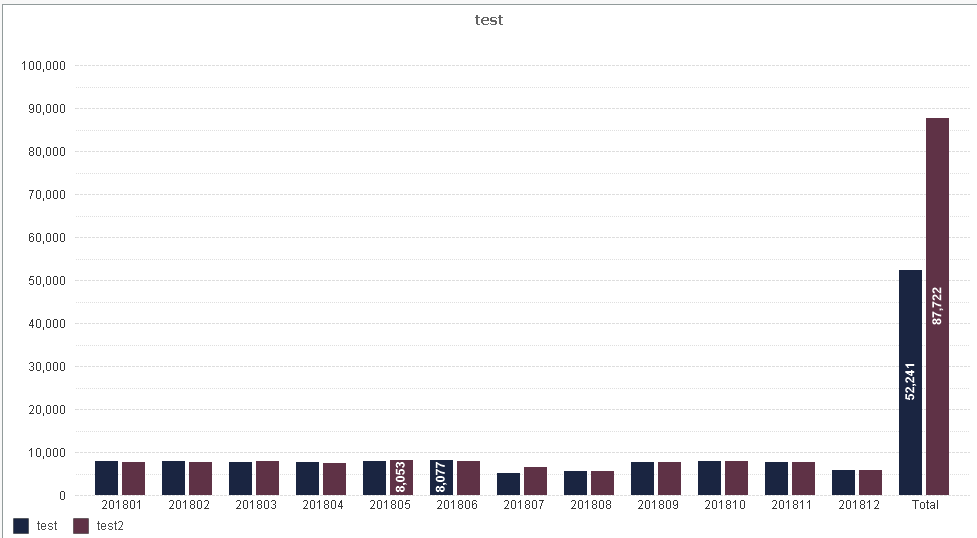
O only need to change the Total axis to the right.
Anyideas?
Thanks in advance.
Best Regards
Bruno Paulo
Accepted Solutions
- Mark as New
- Bookmark
- Subscribe
- Mute
- Subscribe to RSS Feed
- Permalink
- Report Inappropriate Content
If anyone has this problem, the solution is get 2 objects and use white text boxes in order to fill the gaps because they cant have same size in order to get same width on the bars. And use transparency (Colors menu) and position 1 of them in bottom (layer menu). Isn't absolutely perfect but it was the best i can. Maybe with some more efford u can a bit
more.
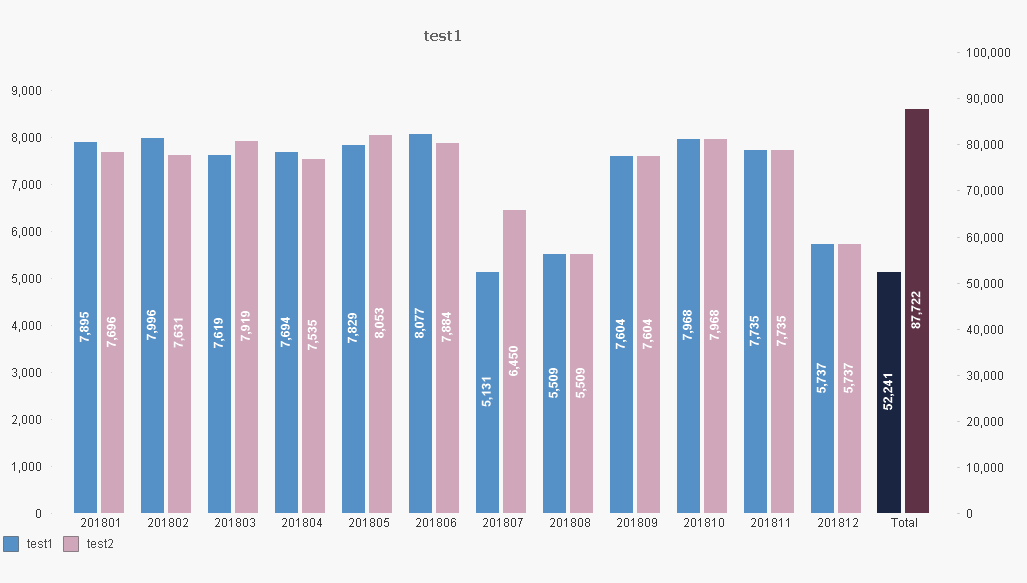
Best Regards
Bruno
- Mark as New
- Bookmark
- Subscribe
- Mute
- Subscribe to RSS Feed
- Permalink
- Report Inappropriate Content
I donot think that it's possible. As I remember I used a Workaround to get this done:
use a Container and place the Chart without total at left and create a new Chart only with total
and place it at right in the container
- Mark as New
- Bookmark
- Subscribe
- Mute
- Subscribe to RSS Feed
- Permalink
- Report Inappropriate Content
I'm assuming on total you put sum total without dimension correct? How did u match the grid? and how did you label the total side (on x axis)?
Best regards
Bruno Paulo
- Mark as New
- Bookmark
- Subscribe
- Mute
- Subscribe to RSS Feed
- Permalink
- Report Inappropriate Content
For the right Chart I have a dummy Dimension "Total"
The axes donot match, because the values are different (~6 vs 52). If you want to see the relative sizes you would get it like your Picture above
I guess that you could achieve that the text on x axes will be on same height etc.
what is your expected Output?

- Mark as New
- Bookmark
- Subscribe
- Mute
- Subscribe to RSS Feed
- Permalink
- Report Inappropriate Content
If anyone has this problem, the solution is get 2 objects and use white text boxes in order to fill the gaps because they cant have same size in order to get same width on the bars. And use transparency (Colors menu) and position 1 of them in bottom (layer menu). Isn't absolutely perfect but it was the best i can. Maybe with some more efford u can a bit
more.
Best Regards
Bruno