Unlock a world of possibilities! Login now and discover the exclusive benefits awaiting you.
- Qlik Community
- :
- All Forums
- :
- QlikView App Dev
- :
- Re: Bar chart with Prev 12 months Rolling 6 month
- Subscribe to RSS Feed
- Mark Topic as New
- Mark Topic as Read
- Float this Topic for Current User
- Bookmark
- Subscribe
- Mute
- Printer Friendly Page
- Mark as New
- Bookmark
- Subscribe
- Mute
- Subscribe to RSS Feed
- Permalink
- Report Inappropriate Content
Bar chart with Prev 12 months Rolling 6 month
Hi All,
I need to create bar chart.
Dimension -MonthYear
Bar chart should display dimension values only for last 12 Months. And each bar should display rolling 6 months of data.
for eg
I will have 12 bars for last 12 months (Sep-2014 to Aug 2015). Now the Sep-14 bar should display the values of rolling 6 months.
So Sep-2014 bar will display the values (Apr-2014 to Sep-2014). Like wise each bar should display rolling 6 months value.
Hope it is clear
- « Previous Replies
-
- 1
- 2
- Next Replies »
- Mark as New
- Bookmark
- Subscribe
- Mute
- Subscribe to RSS Feed
- Permalink
- Report Inappropriate Content
Hi,
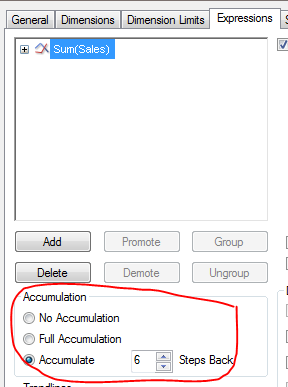
Before going into too deep, have you tried using "Accumulate" option in the expression tab? You can set it to 6 steps back.
- Mark as New
- Bookmark
- Subscribe
- Mute
- Subscribe to RSS Feed
- Permalink
- Report Inappropriate Content
I had used this, but issue is when I select the particular month it will not display correct value
- Mark as New
- Bookmark
- Subscribe
- Mute
- Subscribe to RSS Feed
- Permalink
- Report Inappropriate Content
This may help
Calculating rolling n-period totals, averages or other aggregations
- Mark as New
- Bookmark
- Subscribe
- Mute
- Subscribe to RSS Feed
- Permalink
- Report Inappropriate Content
See attached example and this document: Calculating rolling n-period totals, averages or other aggregations
talk is cheap, supply exceeds demand
- Mark as New
- Bookmark
- Subscribe
- Mute
- Subscribe to RSS Feed
- Permalink
- Report Inappropriate Content
I had done that before with slightly different requirement.
Please see the attached.
This may be a startup.
- Mark as New
- Bookmark
- Subscribe
- Mute
- Subscribe to RSS Feed
- Permalink
- Report Inappropriate Content
gwassenaarand Kush141087 both your solution works and it is what i need, but I want to achieve this on front end. Is it possible from front end?
- Mark as New
- Bookmark
- Subscribe
- Mute
- Subscribe to RSS Feed
- Permalink
- Report Inappropriate Content
hi swuehl can you please help me to do this from front end?
- Mark as New
- Bookmark
- Subscribe
- Mute
- Subscribe to RSS Feed
- Permalink
- Report Inappropriate Content
Possibly, there are several threads here in the forum covering a front end solution, e.g.
Full accumulation: having dimensions reflecting selection but expression that don't
You can use Sum() instead of FirstSortedValue(), and maybe limit the dimensions shown either by setting in the chart properties or by using set analysis in the outer aggregation.
- Mark as New
- Bookmark
- Subscribe
- Mute
- Subscribe to RSS Feed
- Permalink
- Report Inappropriate Content
Hi swuehl thanks for your kind response. can you please give me a sample? It will be very helpful
- « Previous Replies
-
- 1
- 2
- Next Replies »