Unlock a world of possibilities! Login now and discover the exclusive benefits awaiting you.
- Qlik Community
- :
- All Forums
- :
- QlikView App Dev
- :
- Bar chart with negative numbers going up
- Subscribe to RSS Feed
- Mark Topic as New
- Mark Topic as Read
- Float this Topic for Current User
- Bookmark
- Subscribe
- Mute
- Printer Friendly Page
- Mark as New
- Bookmark
- Subscribe
- Mute
- Subscribe to RSS Feed
- Permalink
- Report Inappropriate Content
Bar chart with negative numbers going up
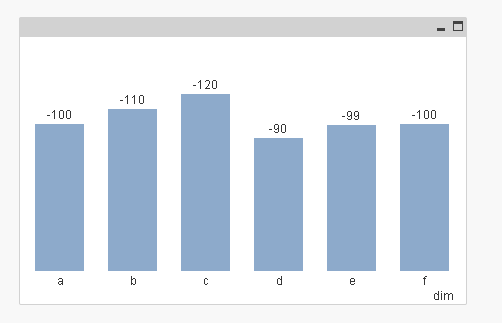
I have a chart where the numbers will always be negative, and the larger the negative number means a larger value. So, rather than having the x-axis displayed at the top of the chart with the bars going down I want the x-axis to be at the bottom with the negative values represented just like a positive number would be (with bars going up) yet the values listed vertically will still be negative numbers.
Is this a simple chart property I am missing?
Thanks
Accepted Solutions
- Mark as New
- Bookmark
- Subscribe
- Mute
- Subscribe to RSS Feed
- Permalink
- Report Inappropriate Content
Hi Jessica,
The dual function can help you to easily obtain the desired result.
See attached example.
Kind regards
Carlos
- Mark as New
- Bookmark
- Subscribe
- Mute
- Subscribe to RSS Feed
- Permalink
- Report Inappropriate Content
Create two same expression
Multiply first expression by -1 and select Bar in expression tab and deselect Values on data points
2nd expression without multiply by -1 and deselect Bar in expression tab and select values on data points.
Update : Check enclosed file..
- Mark as New
- Bookmark
- Subscribe
- Mute
- Subscribe to RSS Feed
- Permalink
- Report Inappropriate Content
You could also format the numbers for the chart so that they had a "-" before them - They would not be negative but would alter their format.
- Mark as New
- Bookmark
- Subscribe
- Mute
- Subscribe to RSS Feed
- Permalink
- Report Inappropriate Content
Hi Jessica,
The dual function can help you to easily obtain the desired result.
See attached example.
Kind regards
Carlos
- Mark as New
- Bookmark
- Subscribe
- Mute
- Subscribe to RSS Feed
- Permalink
- Report Inappropriate Content
If want to show values always negative write your expression like
=Sum(sale) *-1
And
-Sum(sale)
But depends on the data on the fields according to that you have to use.
Regards
- Mark as New
- Bookmark
- Subscribe
- Mute
- Subscribe to RSS Feed
- Permalink
- Report Inappropriate Content
try with a dual expression
dual(num(sum(val), '#.##0'), sum(val)*-1)