Unlock a world of possibilities! Login now and discover the exclusive benefits awaiting you.
- Qlik Community
- :
- All Forums
- :
- QlikView App Dev
- :
- Bar in table chart
- Subscribe to RSS Feed
- Mark Topic as New
- Mark Topic as Read
- Float this Topic for Current User
- Bookmark
- Subscribe
- Mute
- Printer Friendly Page
- Mark as New
- Bookmark
- Subscribe
- Mute
- Subscribe to RSS Feed
- Permalink
- Report Inappropriate Content
Bar in table chart
hi
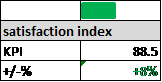
is it possible to get exactly the box below in qlikview? i think with the mini-chart option
the KPI can be any number or indicator, the +/-% a change from this point to a previous period. I think that should be possible, but as pivot table? not as table diagram, right?
what i do not how to do, is how to place the bar chart there? It shall be green if it is positive and red if it is negative (the +/-% field)
Is it possible to put the bar in the first row? and then the title? any help will be very welcome
felipe
- « Previous Replies
-
- 1
- 2
- Next Replies »
- Mark as New
- Bookmark
- Subscribe
- Mute
- Subscribe to RSS Feed
- Permalink
- Report Inappropriate Content
if the bar were below the title, only one table diagram would be appropriate with mini-chart, what do you think?
- Mark as New
- Bookmark
- Subscribe
- Mute
- Subscribe to RSS Feed
- Permalink
- Report Inappropriate Content
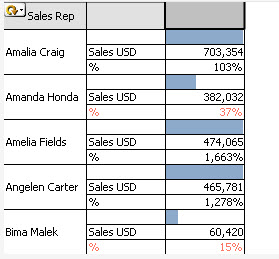
If below chart fits your need...Grab it from the QV example that comes with the installation.
Look for Data visualizations.qvw --> Tables sheet.
Modified little bit to fit your need. Converted staright table to Pivot
- Mark as New
- Bookmark
- Subscribe
- Mute
- Subscribe to RSS Feed
- Permalink
- Report Inappropriate Content
thanks, i never saw the examples, seems to be what i am looking for, lets see how it goes
- Mark as New
- Bookmark
- Subscribe
- Mute
- Subscribe to RSS Feed
- Permalink
- Report Inappropriate Content
Pivot table offers about all the column to be represented as Gauge or chart
- Mark as New
- Bookmark
- Subscribe
- Mute
- Subscribe to RSS Feed
- Permalink
- Report Inappropriate Content
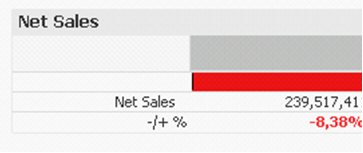
Hi, how can you get the -8.38% represented on the left side? i tried using the chart configuration option, but i cannot. there is a "colomix wizard" where i think i could do it, but i do not have it in my qlikview, it is version 11.2 Do you know if i have to installed it? according to the manual, it shall be under "File/Edit Expression dialog", but i do not see it. Is there any other way to get this?
or how can you get the bar to the left. It shall go to the left, as it it negative., many thanks
- Mark as New
- Bookmark
- Subscribe
- Mute
- Subscribe to RSS Feed
- Permalink
- Report Inappropriate Content
Look in Presentation tab --> Alignment (Right top corner).
Click on each expression and align as you need.
- Mark as New
- Bookmark
- Subscribe
- Mute
- Subscribe to RSS Feed
- Permalink
- Report Inappropriate Content
the problem is more to adjust the bar to the formula. If the -/+ % is positive, the bar shall be green and go to the right on that percentage. In this case the bar is negative -8.38%, so the bar shall be red, and shall be display on the left side (would that be possible?), at -8.38% of a total scale of 100%
Best
Felipe
- Mark as New
- Bookmark
- Subscribe
- Mute
- Subscribe to RSS Feed
- Permalink
- Report Inappropriate Content
do you know how can i deal with negative values? i got only one segment which changes to green if the value is positve but i cannot get the negative value within one segement
- Mark as New
- Bookmark
- Subscribe
- Mute
- Subscribe to RSS Feed
- Permalink
- Report Inappropriate Content
That's not possible. You can fake it somewhat by manipulating the gauge color and the expression background color. See attached example.
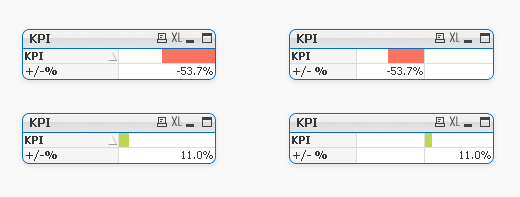
talk is cheap, supply exceeds demand
- « Previous Replies
-
- 1
- 2
- Next Replies »