Unlock a world of possibilities! Login now and discover the exclusive benefits awaiting you.
- Qlik Community
- :
- All Forums
- :
- QlikView App Dev
- :
- Barchart with Drill Down Groups
- Subscribe to RSS Feed
- Mark Topic as New
- Mark Topic as Read
- Float this Topic for Current User
- Bookmark
- Subscribe
- Mute
- Printer Friendly Page
- Mark as New
- Bookmark
- Subscribe
- Mute
- Subscribe to RSS Feed
- Permalink
- Report Inappropriate Content
Barchart with Drill Down Groups
I consolidate charts which had been created with version 9 and many charts are very similiar.
Now I have two charts which differ only in the drill down group. Lets say DrillGrA and DrillGrB.
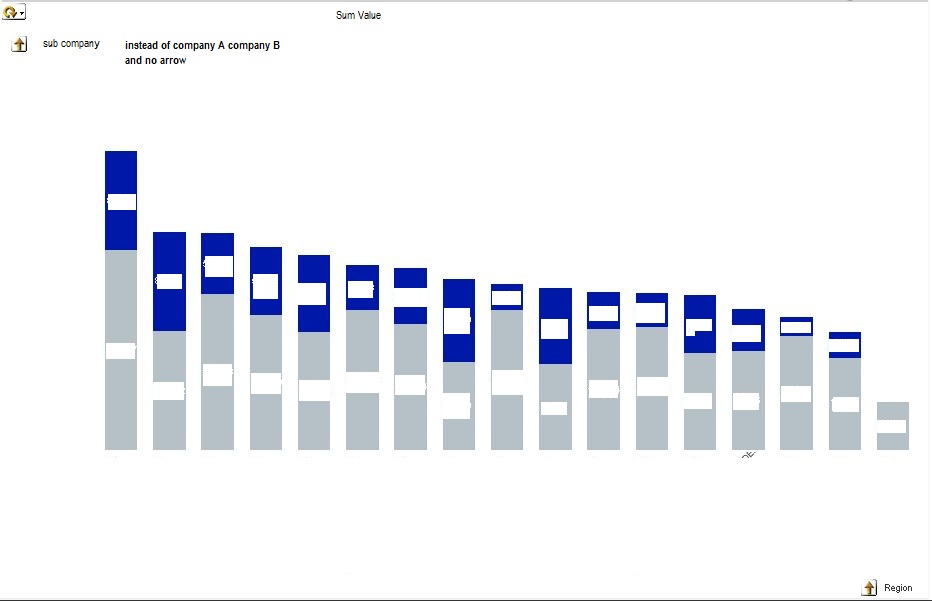
The actual chart show the revenue by sub company and each drill works fine
When I create one chart with Dimension "DrillGrA" and conditional show (Group=A) and then DrillGrB (Group=B) and the final dimension "sub company" (expressions are same as in current charts)., I have the following problems:
- legend of sub companys are not shown any more
- instead Drill Up arrow with label of "sub company" is shown ("sub company" shown instead of "CompanyA, Company B,.."
- there should be only ONE Drill Arrow (lower right corner = Region)
- the cycle group is shown correct (changes between sum and count)
I cannot upload a Qlikview document (not allowed by company guideline, even a small sample not possible)
I work with 11.20 IR and SR5.
How can I get the current look or do I have to keep 2 charts???