Unlock a world of possibilities! Login now and discover the exclusive benefits awaiting you.
- Qlik Community
- :
- All Forums
- :
- QlikView App Dev
- :
- Barcode Graph changing colors
- Subscribe to RSS Feed
- Mark Topic as New
- Mark Topic as Read
- Float this Topic for Current User
- Bookmark
- Subscribe
- Mute
- Printer Friendly Page
- Mark as New
- Bookmark
- Subscribe
- Mute
- Subscribe to RSS Feed
- Permalink
- Report Inappropriate Content
Barcode Graph changing colors
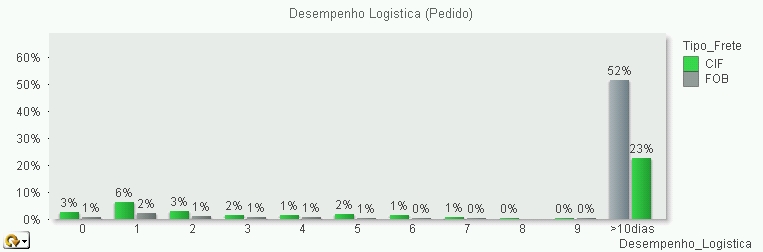
Hi, I have a barcode graph that I have l limited the X dimension to maximum number visible = 10 and showing the others summarized. The problem is that in the column that shows the other, is changing the color of the Y dimension and I have no idea how to solve this.
I´ve tried to classify the dimensions but with no success.
Can anyone help me?
Here is the image. The last information "> 10 dias" has the colors changed
- Mark as New
- Bookmark
- Subscribe
- Mute
- Subscribe to RSS Feed
- Permalink
- Report Inappropriate Content
Hi
Could you post an image to show us what you mean?
Regards
Jonathan
- Mark as New
- Bookmark
- Subscribe
- Mute
- Subscribe to RSS Feed
- Permalink
- Report Inappropriate Content
You could probably define color in each of the dimension properties.
BR/ Subin
- Mark as New
- Bookmark
- Subscribe
- Mute
- Subscribe to RSS Feed
- Permalink
- Report Inappropriate Content
Hi
Have you tried checking the Persistent Colors box on the Chart Properties | Colors tab?
Regards
Jonathan
- Mark as New
- Bookmark
- Subscribe
- Mute
- Subscribe to RSS Feed
- Permalink
- Report Inappropriate Content
Sorry, but not worked
- Mark as New
- Bookmark
- Subscribe
- Mute
- Subscribe to RSS Feed
- Permalink
- Report Inappropriate Content
I did not find a way to change the color of the dimension. Where is it?
- Mark as New
- Bookmark
- Subscribe
- Mute
- Subscribe to RSS Feed
- Permalink
- Report Inappropriate Content
Hi,
Here is the screenshot for it to be changed. You can give any condition as well for the color you need.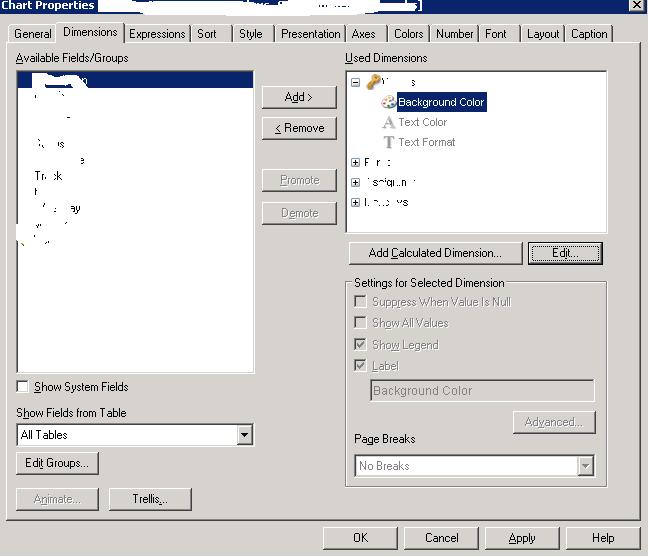
BR/ Subin