Unlock a world of possibilities! Login now and discover the exclusive benefits awaiting you.
- Qlik Community
- :
- All Forums
- :
- QlikView App Dev
- :
- Bubble Chart
Options
- Subscribe to RSS Feed
- Mark Topic as New
- Mark Topic as Read
- Float this Topic for Current User
- Bookmark
- Subscribe
- Mute
- Printer Friendly Page
Turn on suggestions
Auto-suggest helps you quickly narrow down your search results by suggesting possible matches as you type.
Showing results for
Anonymous
Not applicable
2014-12-13
03:22 PM
- Mark as New
- Bookmark
- Subscribe
- Mute
- Subscribe to RSS Feed
- Permalink
- Report Inappropriate Content
Bubble Chart
I have the following bubble chart in a Google Map:
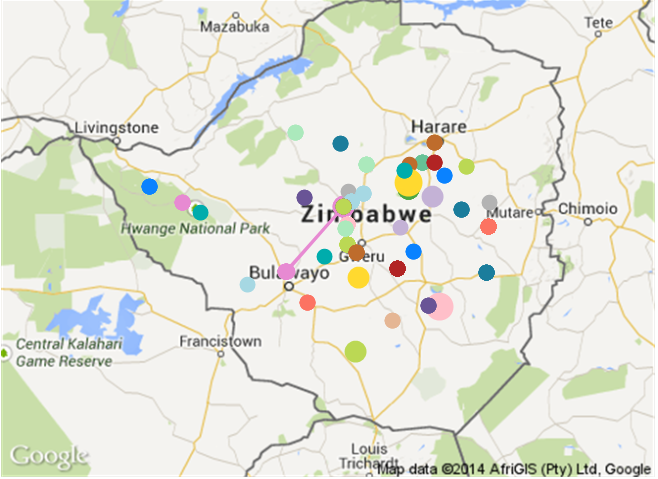
The bubbles represent licensed premises in each city of the country. The Premises details in terms of location are summarised in the following table:
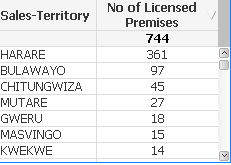
My expression for the size of the bubble is:
TextCount([Premises Type)] which is basically the numbers displayed in the above table. However my bubble sizes seem not to be in relation to this premises count.
What could be going wrong?
Regards
Chris
- Tags:
- qlikview
420 Views
2 Replies
Anonymous
Not applicable
2014-12-14
05:59 AM
Author
- Mark as New
- Bookmark
- Subscribe
- Mute
- Subscribe to RSS Feed
- Permalink
- Report Inappropriate Content
Well the bubble size look different to me. Kindly upload a sample qvw, it would make things more clear.
164 Views
Anonymous
Not applicable
2014-12-14
06:58 AM
Author
- Mark as New
- Bookmark
- Subscribe
- Mute
- Subscribe to RSS Feed
- Permalink
- Report Inappropriate Content
Utkarsh
Many thanks, i will do so.
Regards.
Chris
164 Views