Unlock a world of possibilities! Login now and discover the exclusive benefits awaiting you.
- Qlik Community
- :
- All Forums
- :
- QlikView App Dev
- :
- Bucket Rank'ed Data
- Subscribe to RSS Feed
- Mark Topic as New
- Mark Topic as Read
- Float this Topic for Current User
- Bookmark
- Subscribe
- Mute
- Printer Friendly Page
- Mark as New
- Bookmark
- Subscribe
- Mute
- Subscribe to RSS Feed
- Permalink
- Report Inappropriate Content
Bucket Rank'ed Data
Hi,
First off if there is an answer already in the community then I am sorry I have missed it...
I am looking to Rank and Bucket Data... what I would like to do is rank a number of customers based on their value. I would then like to take the total value and split that into 10 equal buckets (i.e. 10% gaps) and count the number of customers (based on their ranking order) that it takes to fill that bucket. Also it would be good to know the actual value of that bucket (as it is not expected that things will split nicely)
So I would end up with something like:
| Number of Clients | Value | Bucket |
|---|---|---|
| 5 | 1,637 | 1 |
| 16 | 1,642 | 2 |
| 24 | 1,620 | 3 |
| ... | ... |
Now I felt that I could do this with a combination of AGGR, Class and Rank (from looking around and reading) but I cannot seem to get anything to work as I would like (i.e. the above table) or get close.
I did find the following against an example that looked positive:
=AGGR(CLASS(RANK(SUM([Revenue])),10,SUM([Revenue])),Company)
Yet that does not seem to want to allow me to change the classing into a bucket that I can group the data by....
... eventually this will be tables and charts... apparently 
Would anybody have any ideas or something to push me in the right direction...
Thanks for any ideas and\or help.
- Mark as New
- Bookmark
- Subscribe
- Mute
- Subscribe to RSS Feed
- Permalink
- Report Inappropriate Content
Would you be able to provide some sample data to get the above output?
- Mark as New
- Bookmark
- Subscribe
- Mute
- Subscribe to RSS Feed
- Permalink
- Report Inappropriate Content
I have tried to complete a mock up of the table using some data... hopefully this will make a bit of sense and it does show that the bucket and the data will never fully line up due to the way that the data works.
- Mark as New
- Bookmark
- Subscribe
- Mute
- Subscribe to RSS Feed
- Permalink
- Report Inappropriate Content
In your database do you have the sales/value aggregated at customer level or do you have multiple rows for each customer which needs to be aggregated on the front end? Based on your sample, you only had one row for each customer, there is a QV12 solution which I can propose to get to this
Dimension
=Aggr(
If(RangeSum(Above(TOTAL Sum(Value), 0, RowNo(TOTAL))) < 1*Sum(TOTAL Value)/10, 1,
If(RangeSum(Above(TOTAL Sum(Value), 0, RowNo(TOTAL))) < 2*Sum(TOTAL Value)/10, 2,
If(RangeSum(Above(TOTAL Sum(Value), 0, RowNo(TOTAL))) < 3*Sum(TOTAL Value)/10, 3,
If(RangeSum(Above(TOTAL Sum(Value), 0, RowNo(TOTAL))) < 4*Sum(TOTAL Value)/10, 4,
If(RangeSum(Above(TOTAL Sum(Value), 0, RowNo(TOTAL))) < 5*Sum(TOTAL Value)/10, 5,
If(RangeSum(Above(TOTAL Sum(Value), 0, RowNo(TOTAL))) < 6*Sum(TOTAL Value)/10, 6,
If(RangeSum(Above(TOTAL Sum(Value), 0, RowNo(TOTAL))) < 7*Sum(TOTAL Value)/10, 7,
If(RangeSum(Above(TOTAL Sum(Value), 0, RowNo(TOTAL))) < 8*Sum(TOTAL Value)/10, 8,
If(RangeSum(Above(TOTAL Sum(Value), 0, RowNo(TOTAL))) < 9*Sum(TOTAL Value)/10, 9, 10)))))))))
, (Value,(NUMERIC, DESCENDING)), Value)
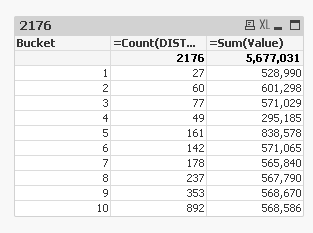
Expression
=Count(DISTINCT Customer)
=Sum(Value)
Dimension uses a concept which is only available in QlikView 12. The sortable Aggr function is finally here!. This concept allowed me to sort the customer descending by Value. But this only worked because the data was already aggregated. There is still no way to sort by an expression such as Sum(Value) which would be needed if you data is not aggregated.
Let me know what you think.
Best,
Sunny