Unlock a world of possibilities! Login now and discover the exclusive benefits awaiting you.
- Qlik Community
- :
- All Forums
- :
- QlikView App Dev
- :
- Calculated dimensions and Dimension limits
- Subscribe to RSS Feed
- Mark Topic as New
- Mark Topic as Read
- Float this Topic for Current User
- Bookmark
- Subscribe
- Mute
- Printer Friendly Page
- Mark as New
- Bookmark
- Subscribe
- Mute
- Subscribe to RSS Feed
- Permalink
- Report Inappropriate Content
Calculated dimensions and Dimension limits
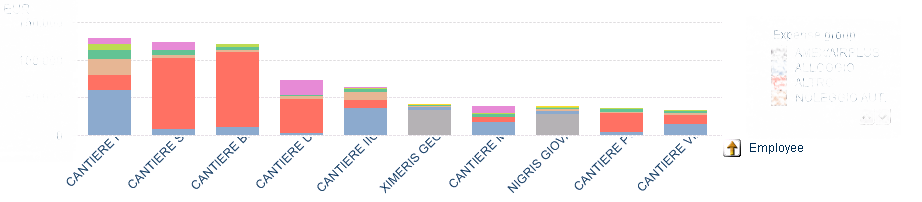
Hi there, I am trying to display bar chart x-axis labels spanned over 2 lines and to do so I followed what this reply suggests, i.e. using a calculated dimension that adds a carriage return somewhere in the middle of the field that you want to use as a dimension.
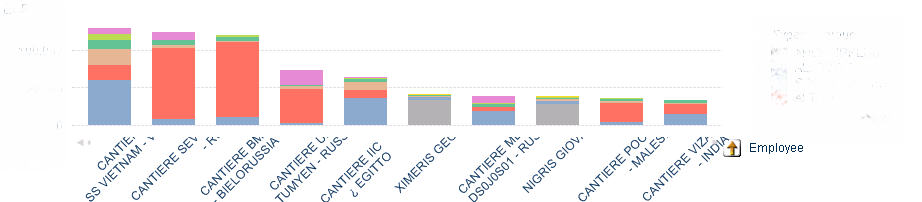
The trick seems to work in terms of labels but, actually, it seems like unexpected filters get applied as you can see by comparing the following two pictures.
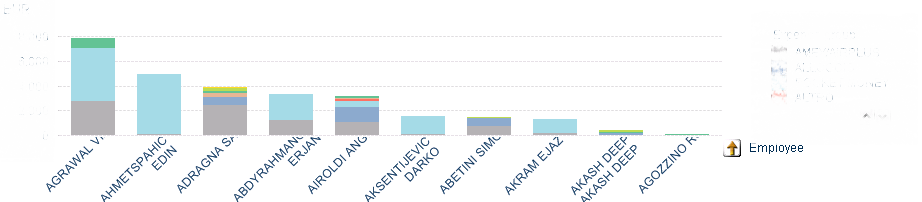
The curious thing is that if I take the "Restrict which values are displayed using the first expression" flag off, I get close to the result I want to achieve:
Note the scrollbar that is now shown and that I don't want to display.
How can this be fiixed?
Accepted Solutions
- Mark as New
- Bookmark
- Subscribe
- Mute
- Subscribe to RSS Feed
- Permalink
- Report Inappropriate Content
I found a very simple workaround: using (when it does not make any difference) the "Largest" criterion instead of "First" in the "Dimension limits" tab of the chart proterties.
I don't know why "First" was causing the problem but it was!