Unlock a world of possibilities! Login now and discover the exclusive benefits awaiting you.
- Qlik Community
- :
- All Forums
- :
- QlikView App Dev
- :
- Calculating a dimension to show Highest Month and ...
- Subscribe to RSS Feed
- Mark Topic as New
- Mark Topic as Read
- Float this Topic for Current User
- Bookmark
- Subscribe
- Mute
- Printer Friendly Page
- Mark as New
- Bookmark
- Subscribe
- Mute
- Subscribe to RSS Feed
- Permalink
- Report Inappropriate Content
Calculating a dimension to show Highest Month and Lowest Month Values
I have a table with values in. I'd to show the highest month and lowest month
Orig Table
|
New Table Required
| High | Low | |
| Amendments & Changes | Jun-14 (901) | Jul-14(0) |
| Billing | Apr-14 (2831) | Jul-14(508) |
| Direct Debits | Jun-14 (9790) | Jul-14(571) |
(Just first 3 lines shown to illustrate, need all lines including)
I've had a play around with the Rank and Aggr functions but haven't had much luck. Can anyone help?
Accepted Solutions
- Mark as New
- Bookmark
- Subscribe
- Mute
- Subscribe to RSS Feed
- Permalink
- Report Inappropriate Content
Hi,
one possible solution:
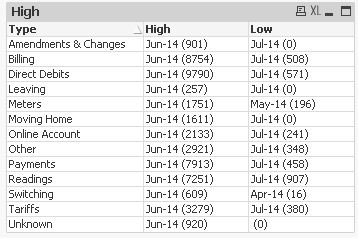
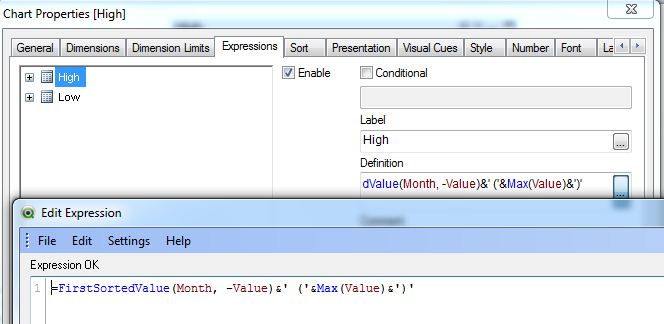
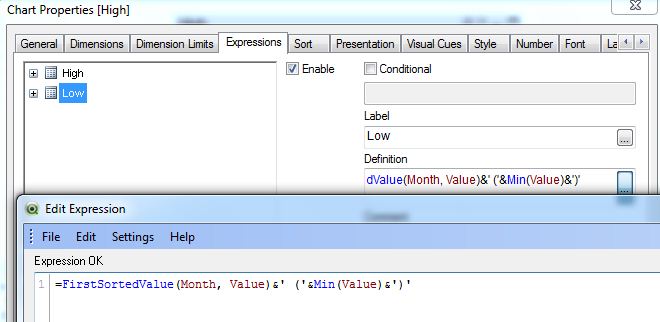
table1:
CrossTable (MonthText, Value)
LOAD *
FROM [http://community.qlik.com/thread/131165]
(html, codepage is 1252, embedded labels, table is @1);

Left Join (table1)
LOAD Distinct
  MonthText,
  Date#(MonthText, 'MMM-YY') as Month
Resident table1;
hope this helps
regards
Marco
- Mark as New
- Bookmark
- Subscribe
- Mute
- Subscribe to RSS Feed
- Permalink
- Report Inappropriate Content
Hi,
one possible solution:
table1:
CrossTable (MonthText, Value)
LOAD *
FROM [http://community.qlik.com/thread/131165]
(html, codepage is 1252, embedded labels, table is @1);

Left Join (table1)
LOAD Distinct
  MonthText,
  Date#(MonthText, 'MMM-YY') as Month
Resident table1;
hope this helps
regards
Marco