Unlock a world of possibilities! Login now and discover the exclusive benefits awaiting you.
- Qlik Community
- :
- All Forums
- :
- QlikView App Dev
- :
- Calculating formula with past values but ignoring ...
- Subscribe to RSS Feed
- Mark Topic as New
- Mark Topic as Read
- Float this Topic for Current User
- Bookmark
- Subscribe
- Mute
- Printer Friendly Page
- Mark as New
- Bookmark
- Subscribe
- Mute
- Subscribe to RSS Feed
- Permalink
- Report Inappropriate Content
Calculating formula with past values but ignoring them (dimensions) in Chart
Hello community,
please take a look at the empeded qvw.
I have to calculate weekyears and weekdays averages of a daily amount of past values.
Second I need to take these values as prediction for the same weekday in future weeks.
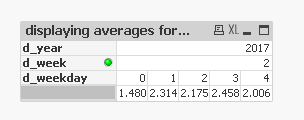
| d_week | 2 | ||||
|---|---|---|---|---|---|
| d_weekday | 0 | 1 | 2 | 3 | 4 |
| 1480 | 2314 | 2175 | 2458 | 2006 | |
As an example the calculated average for all weekdays 2 in week 2 is 2,175 (upper table).
This value has to be shown in the lower table which shall only show future weeks. Is this possible?
I used the following:
=Avg(TOTAL <d_weekday, d_week>
  Aggr(
  Sum(amount)
  , d_year, d_week, d_weekday)
)
Which produces the following table:
| d_year | 2012 | 2013 | 2014 | 2015 | 2016 | 2017 | |||||||||||||||||||||||
|---|---|---|---|---|---|---|---|---|---|---|---|---|---|---|---|---|---|---|---|---|---|---|---|---|---|---|---|---|---|
| d_week | 2 | 2 | 2 | 2 | 2 | 2 | |||||||||||||||||||||||
| d_weekday | 0 | 1 | 2 | 3 | 4 | 0 | 1 | 2 | 3 | 4 | 0 | 1 | 2 | 3 | 4 | 0 | 1 | 2 | 3 | 4 | 0 | 2 | 3 | 4 | 0 | 1 | 2 | 3 | 4 |
| 1480 | 2314 | 2175 | 2458 | 2006 | 1480 | 2314 | 2175 | 2458 | 2006 | 1480 | 2314 | 2175 | 2458 | 2006 | 1480 | 2314 | 2175 | 2458 | 2006 | 1480 | 2175 | 2458 | 2006 | 1480 | 2314 | 2175 | 2458 | 2006 | |
Unfortunately I am not able to show only future weeks - that would be week 2 in 2017.
What am I doing wrong?
I'd be glad for any help.
Thanks, Falko Thom
Accepted Solutions
- Mark as New
- Bookmark
- Subscribe
- Mute
- Subscribe to RSS Feed
- Permalink
- Report Inappropriate Content
May be this:
=If(d_date >= Today(), Avg(TOTAL <d_weekday, d_week> Aggr(
Sum(amount)
, d_year, d_week, d_weekday))
)
- Mark as New
- Bookmark
- Subscribe
- Mute
- Subscribe to RSS Feed
- Permalink
- Report Inappropriate Content
May be this:
=If(d_date >= Today(), Avg(TOTAL <d_weekday, d_week> Aggr(
Sum(amount)
, d_year, d_week, d_weekday))
)
- Mark as New
- Bookmark
- Subscribe
- Mute
- Subscribe to RSS Feed
- Permalink
- Report Inappropriate Content
Thanks a lot. That kinda helped me very much.
I always tried to find a solution using a dynamic dimension. But that's far better.