Unlock a world of possibilities! Login now and discover the exclusive benefits awaiting you.
- Qlik Community
- :
- All Forums
- :
- QlikView App Dev
- :
- Can I show zero but not null in bar chart?
- Subscribe to RSS Feed
- Mark Topic as New
- Mark Topic as Read
- Float this Topic for Current User
- Bookmark
- Subscribe
- Mute
- Printer Friendly Page
- Mark as New
- Bookmark
- Subscribe
- Mute
- Subscribe to RSS Feed
- Permalink
- Report Inappropriate Content
Can I show zero but not null in bar chart?
Hi,
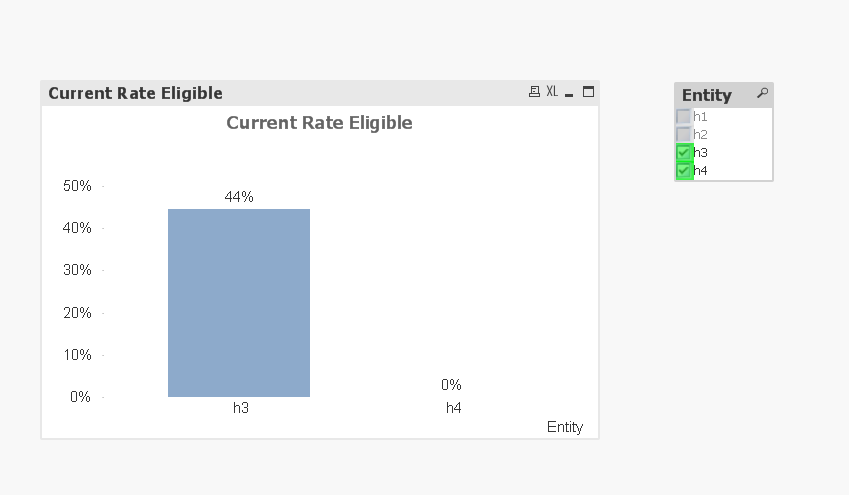
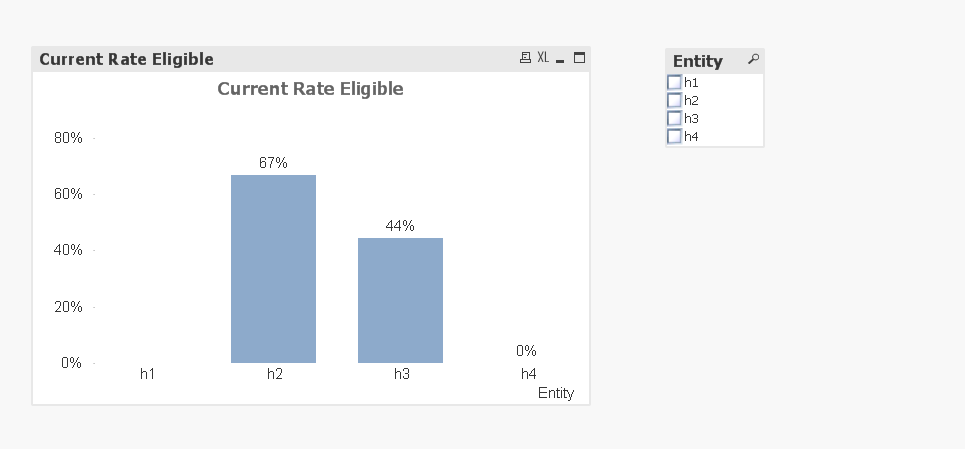
I used bar chart to display rate for entities. Data looks like below. Rate is calculated sum(Num)/sum(Den) for each Entity. Also, there is another condition should apply which we only take sum(Den)>=5, otherwise do not show this entity in the chart. So, h1 should not show up. But, for h4, although total numerator is 0, it has valid number of denominators, it should still show up. I play around the bar chart properties, couldn't achieve this. How can I only show h2, h3 and h4?
Also, user can select any entities, I want to always show h2, no matter it is selected or not. Is that possible? Please use my attachment to look into details.
Thanks in advance.
| Entity | Member | Num | Den |
| h1 | m1 | 1 | 1 |
| h1 | m2 | 0 | 1 |
| h1 | m3 | 1 | 1 |
| h2 | m4 | 1 | 1 |
| h2 | m5 | 0 | 1 |
| h2 | m6 | 1 | 1 |
| h2 | m7 | 0 | 1 |
| h2 | m8 | 1 | 1 |
| h2 | m9 | 1 | 1 |
| h2 | m10 | 1 | 1 |
| h2 | m11 | 0 | 1 |
| h2 | m12 | 1 | 1 |
| h3 | m4 | 1 | 1 |
| h3 | m5 | 0 | 1 |
| h3 | m6 | 0 | 1 |
| h3 | m7 | 0 | 1 |
| h3 | m8 | 1 | 1 |
| h3 | m9 | 0 | 1 |
| h3 | m10 | 1 | 1 |
| h3 | m11 | 0 | 1 |
| h3 | m12 | 1 | 1 |
| h4 | m4 | 0 | 1 |
| h4 | m5 | 0 | 1 |
| h4 | m6 | 0 | 1 |
| h4 | m7 | 0 | 1 |
| h4 | m8 | 0 | 1 |
| h4 | m9 | 0 | 1 |
| h4 | m10 | 0 | 1 |
| h4 | m11 | 0 | 1 |
| h4 | m12 | 0 | 1 |
- Tags:
- bar chart axes
Accepted Solutions
- Mark as New
- Bookmark
- Subscribe
- Mute
- Subscribe to RSS Feed
- Permalink
- Report Inappropriate Content
You can use Calculated Dimension
=Aggr(If(Sum(Den) >= 5,Entity),Entity)
and check Suppress value when Null
- Mark as New
- Bookmark
- Subscribe
- Mute
- Subscribe to RSS Feed
- Permalink
- Report Inappropriate Content
You can use Calculated Dimension
=Aggr(If(Sum(Den) >= 5,Entity),Entity)
and check Suppress value when Null
- Mark as New
- Bookmark
- Subscribe
- Mute
- Subscribe to RSS Feed
- Permalink
- Report Inappropriate Content
Hi Antonio,
Thanks for your help. It almost worked. But when I put this statement into some NESTED IF, seems got wrong values. If I applied to different conditions separately, every condition the statement works. I will keep trying.
In addition, do you have any suggestion for my second question, always show h2?
- Mark as New
- Bookmark
- Subscribe
- Mute
- Subscribe to RSS Feed
- Permalink
- Report Inappropriate Content
Hi Fion,
second question : I don't think this is possible.
However You can add Text in Chart.
See attachment.
Regards,
Antonio