Unlock a world of possibilities! Login now and discover the exclusive benefits awaiting you.
- Qlik Community
- :
- All Forums
- :
- QlikView App Dev
- :
- Chart - Axes Space
- Subscribe to RSS Feed
- Mark Topic as New
- Mark Topic as Read
- Float this Topic for Current User
- Bookmark
- Subscribe
- Mute
- Printer Friendly Page
- Mark as New
- Bookmark
- Subscribe
- Mute
- Subscribe to RSS Feed
- Permalink
- Report Inappropriate Content
Chart - Axes Space
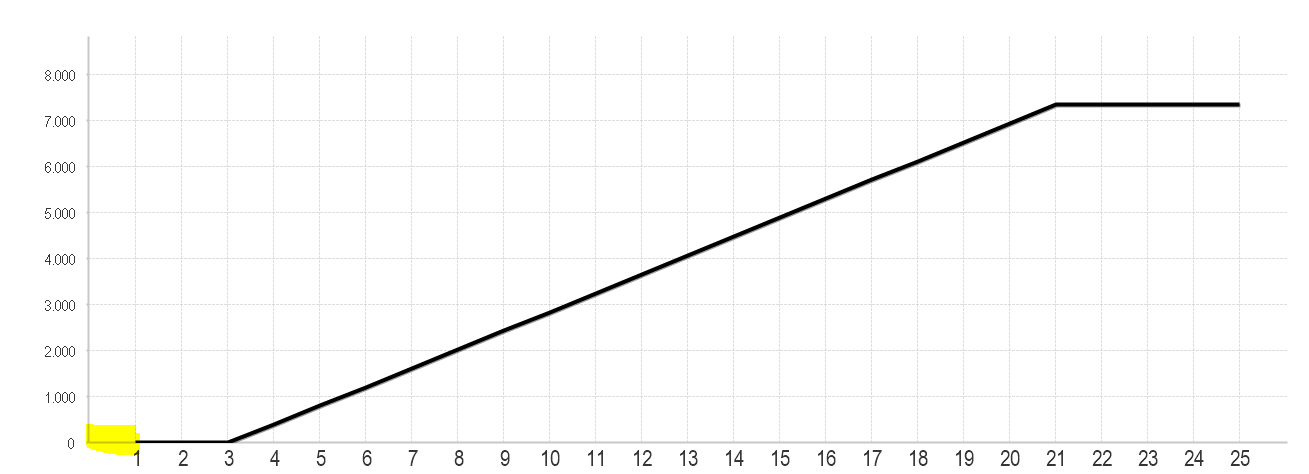
How I can reduce the space marked as Yellow in my chart?
I am trying to have the same space between all the numbers in charts.
Thanks 
- Tags:
- line charts
- Mark as New
- Bookmark
- Subscribe
- Mute
- Subscribe to RSS Feed
- Permalink
- Report Inappropriate Content
The space between all the number is the same??
If you want the space to be smaller, just make the chart smaller, shrink it
- Mark as New
- Bookmark
- Subscribe
- Mute
- Subscribe to RSS Feed
- Permalink
- Report Inappropriate Content
donÄt know exactly what you want
if data starts at x Point 1 you may tick "suppress zero values" (tab presentation)
or you may use static min (tab axes) and set static min to 1
- Mark as New
- Bookmark
- Subscribe
- Mute
- Subscribe to RSS Feed
- Permalink
- Report Inappropriate Content
I can't unsupress zero values because I need it to show all the values. But this numbers represents the days of the Month. So I want that the chart starts at day 1, that's why I want o remove the yellow space.
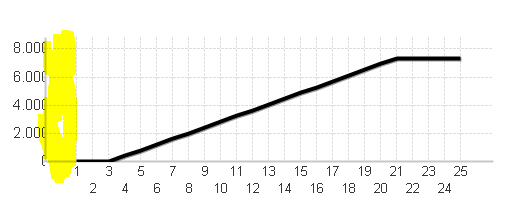
Byron, If I shrink the chart I will get the numbers like that 
Thank you for your response!
- Mark as New
- Bookmark
- Subscribe
- Mute
- Subscribe to RSS Feed
- Permalink
- Report Inappropriate Content
I'm just trying to think if what you are asking is even possible. Logically it wouldn't make sense since the y axis at intersection of x-axis share the same value.
If shrinking gives you what you want, but its the numbers that's the issue then try this
Axis Tab
1) Change dimension alignment from '-' to '/'
2) Change dimension font size to a smaller font
Give this a try and see if you get desired result.
- Mark as New
- Bookmark
- Subscribe
- Mute
- Subscribe to RSS Feed
- Permalink
- Report Inappropriate Content
Hi,
You can do this way ,
Goto -> Chart Properties -> Axes ->Select your expression -> position -> Right (TOP) -> then you can see your y-axes on the other side. 
Hope this helps,
Hirish
“Aspire to Inspire before we Expire!”
- Mark as New
- Bookmark
- Subscribe
- Mute
- Subscribe to RSS Feed
- Permalink
- Report Inappropriate Content
Thank your for yours responses
I need to adapt the layout and increase the chart size.