Unlock a world of possibilities! Login now and discover the exclusive benefits awaiting you.
- Qlik Community
- :
- All Forums
- :
- QlikView App Dev
- :
- Chart colour depending on dynamic Average value
- Subscribe to RSS Feed
- Mark Topic as New
- Mark Topic as Read
- Float this Topic for Current User
- Bookmark
- Subscribe
- Mute
- Printer Friendly Page
- Mark as New
- Bookmark
- Subscribe
- Mute
- Subscribe to RSS Feed
- Permalink
- Report Inappropriate Content
Chart colour depending on dynamic Average value
Hello,
I am relatively new to QlikView and I have come across an issue that I do not know how to solve.
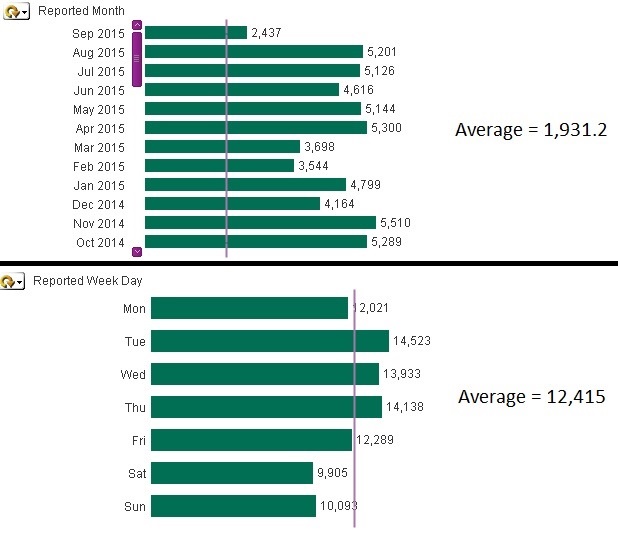
I have a chart which shows the total number of occurrences. Using a cyclic group, I show the occurrences based on different dimensions for example ( as shown on attached image) total number of occurrences per month and total number of occurrences per week day.
I have added the average trendline on the chart and, as expected, it changes for each dimension.
How can I colour the bars with different colours depending if they are above (red) or below (green) the average?
I have done that in a chart with only one dimension by creating a variable vAvg and on the expression background putting a conditional that changes the colour if the value is higher or lower than that vAgv.
However, how can I do that on this scenario where the Average changes every time?
Thank you for your help.
Accepted Solutions
- Mark as New
- Bookmark
- Subscribe
- Mute
- Subscribe to RSS Feed
- Permalink
- Report Inappropriate Content
Hi,
Use the function GetCurrentField(GroupName) to know which dimension in the cyclic group is presented in the graph. Unber the expression, you can press the + sign and in the Background color you can add an if statement together with the GetCurrentField(GroupName) to give the bar a different color if it is below or above the average, where as the vAvg variable will change according to presented Dimension.
Liat
- Mark as New
- Bookmark
- Subscribe
- Mute
- Subscribe to RSS Feed
- Permalink
- Report Inappropriate Content
Thank you Liat Todt.
It has worked perfectly.
Thank you for your help.