Unlock a world of possibilities! Login now and discover the exclusive benefits awaiting you.
- Qlik Community
- :
- All Forums
- :
- QlikView App Dev
- :
- Chart colours to reflect the volume amounts
Options
- Subscribe to RSS Feed
- Mark Topic as New
- Mark Topic as Read
- Float this Topic for Current User
- Bookmark
- Subscribe
- Mute
- Printer Friendly Page
Turn on suggestions
Auto-suggest helps you quickly narrow down your search results by suggesting possible matches as you type.
Showing results for
Creator III
2015-11-05
07:03 AM
- Mark as New
- Bookmark
- Subscribe
- Mute
- Subscribe to RSS Feed
- Permalink
- Report Inappropriate Content
Chart colours to reflect the volume amounts
Hello
I have a Pie chart and I would like the highest - lowest volumes to always have the same colour assigned
I.e.
Group Volume Colour
A 50 Green
B 30 Red
C 20 Yellow
However on the next refresh Group A could have a lower volume and would have a colour of Red and group B now be green as they have the highest volumes
Is this possible to do in Qlikview?
Kind Regards
Helen
121 Views
1 Reply
Master III
2015-11-05
07:42 AM
- Mark as New
- Bookmark
- Subscribe
- Mute
- Subscribe to RSS Feed
- Permalink
- Report Inappropriate Content
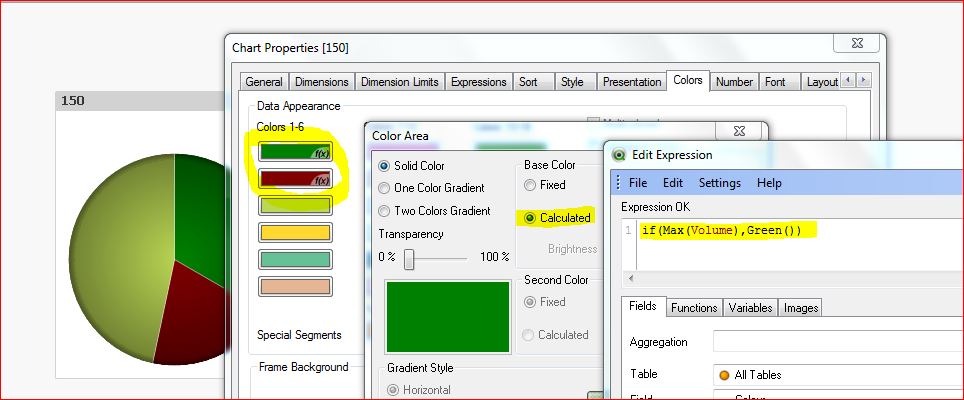
Hi,
May be you can try to change in Colors Tab -> Calculated Condition based color..
Like in the below screen shot..
72 Views